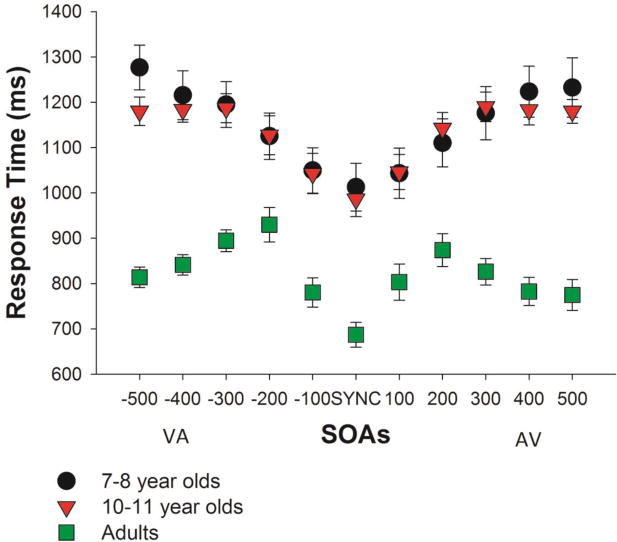
Figure 4. Response Time at Different SOAs.

Time for making a simultaneity judgment at each SOA is shown for the three groups of participants. Error bars represent standard errors of the mean. Note a qualitatively different pattern of RT distribution over different SOAs in children and in adults, with adults' RTs peaking at 200 ms SOA and then shortening at 500 ms SOA and with children's RTs either continuously increasing (the 7-8 year old group) or leveling off after the 200 ms SOA (the 10-11 year old group).
