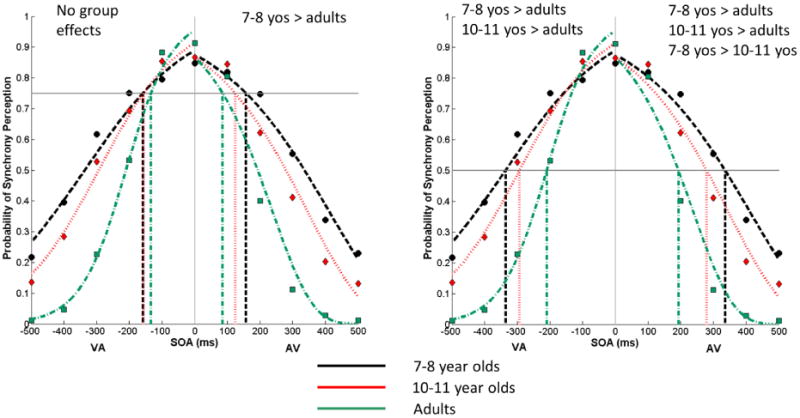
Figure 5. Temporal Binding Windows Measured at 75% and 50% of the Maximum.

Group mean data for the left and right sides of the TBW window at 75% (the left panel) and 50% (right panel) of the maximum are shown. The size of the left TBW at 75% of the maximum was nearly identical for 7-8 and 10-11 year old children. As a result, their drop-down lines overlap. Yos = years of age.
