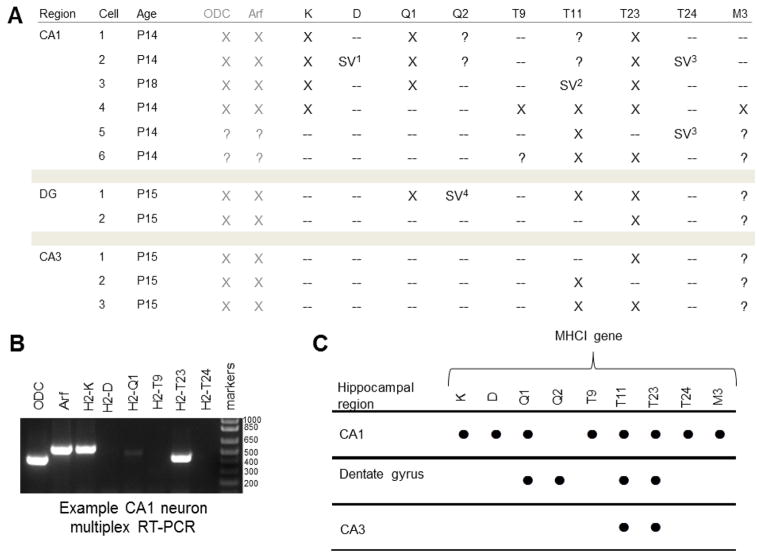
Figure 8. MHCI gene expression in individual P14–18 hippocampal neurons.
A. Table summarizing single-cell RT-PCR data for individual neurons from specific regions of mouse hippocampus.
B. Example gel showing multiplex RT-PCR of cDNA extracted from a single CA1 neuron. Summary. mRNA transcripts for eight MHCI genes were observed in individual CA1 neurons (indicated with ●), while four were observed in granule cells of the dentate gyrus and two were observed in neurons of the CA3 region. Number of individual neurons sampled: CA1, n = 6; Dentate gyrus, n = 2; CA3, n = 3. DG, dentate gyrus; ODC, ornithine decarboxylase (positive control); Arf, ADP-ribosylation factor 1 (positive control); SV, splice variant. “?” indicates RT-PCR not performed on a given sample.
SV1 D splice variant: 818 base pairs (bp) predicted product, 548bp observed, no α1.
SV2 T11 splice variant: 415bp predicted product, 659bp observed, retained second intron.
SV3 T24 splice variant: 736bp predicted product, 184 bp observed, no α2 or α3.
SV 4 Q2 splice variant: 785bp predicted product, 509bp observed, no α3.

