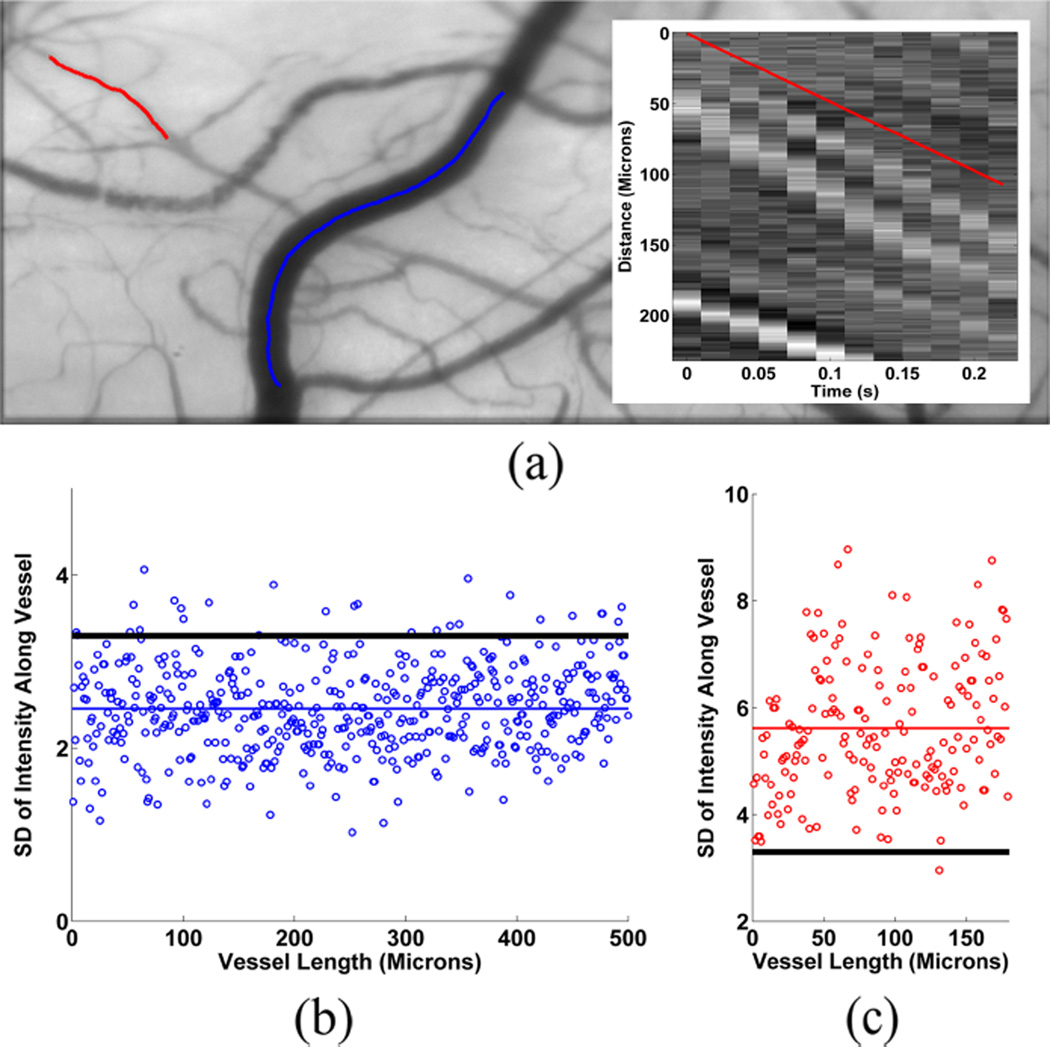
Fig. 4.
(a) Conjunctival microcirculation image displaying the centerlines of two selected vessel segments. (b) SD of intensity values plotted as a function of length for the vessel indicated by the blue centerline. Mean SD (μvessel) (blue horizontal line) is lower than the threshold (Thbackground) (black horizontal line), indicating the lack of discernable blood flow. (c) SD of intensity values plotted as a function of length for the vessel indicated by the red centerline. Mean SD (μvessel) (red horizontal line) is greater than the threshold (Thbackground) (black horizontal line), indicating detectable blood flow. Fig 4 (a) Insert: Spatial-temporal image (STI) generated for the vessel segment indicated by the red centerline. The red line superimposed on the STI displays the calculated slope based on the prominent bands in the STI.

