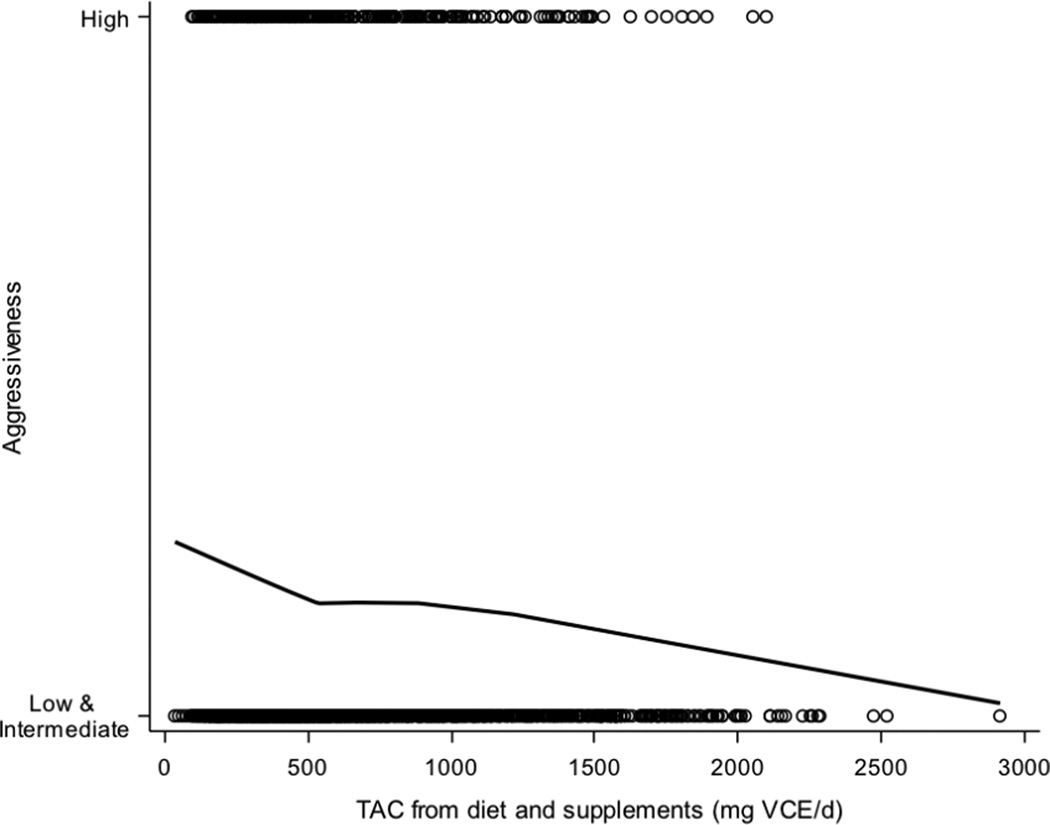
Figure 1.
LOESS plot of average daily TAC from diet and supplements predicting prostate cancer aggressiveness. The solid line is the smoothed LOESS line of TAC predicting aggressiveness; empty circles represent individual participants. The smoothing parameter was chosen based on minimization of the corrected Akaike information criterion (AICC). Abbreviations: TAC, total antioxidant capacity; VCE, vitamin C equivalents.

