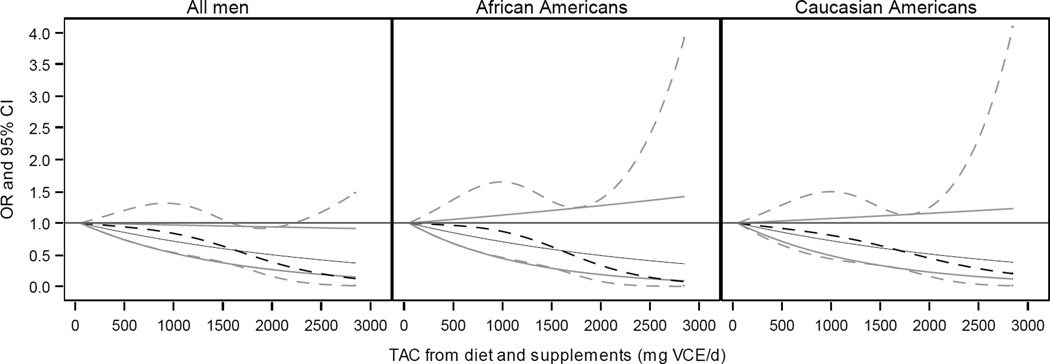
Figure 3.
Plot of odds ratio (black) and 95% confidence interval (grey) for total antioxidant capacity (TAC) of diet and supplements predicting odds of prostate cancer aggressiveness for all men, African Americans, and Caucasian Americans. Solid lines represent linear model of TAC on a continuous scale; broken lines represent model of TAC using a restricted cubic spline with knots located at the 10th, 50th, and 90th percentiles. Models adjusted for average energy intake, age, smoking, race, race-smoking interaction, poverty index, marriage, body mass index, and DRE and PSA screening. Results by race determined using an interaction term between TAC and race.

