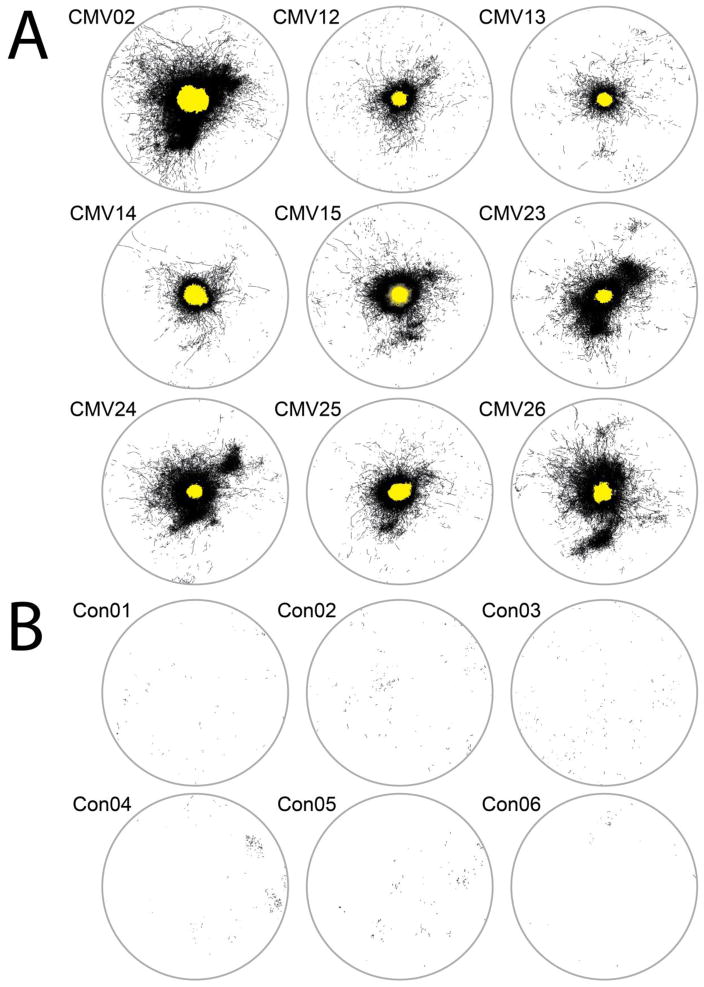
Fig. 4.
A. Axons shown in Fig. 3 were collapsed across all four sections for each of the nine brains injected supragranularly with AAV-CMV-GFP. B. Falsely detected fibers within the analysis region of six non-injected controls were collapsed across sections at the four depths that were analyzed in injected brains. These fibers were traced in coded images interspersed among those comprising the results shown in A. The yellow area in the center of each tracing represents the extent of the saturated labeling at the core of the injection site in deep layer 2/3. The circles measure 7.2 mm in diameter

