Figure 2.

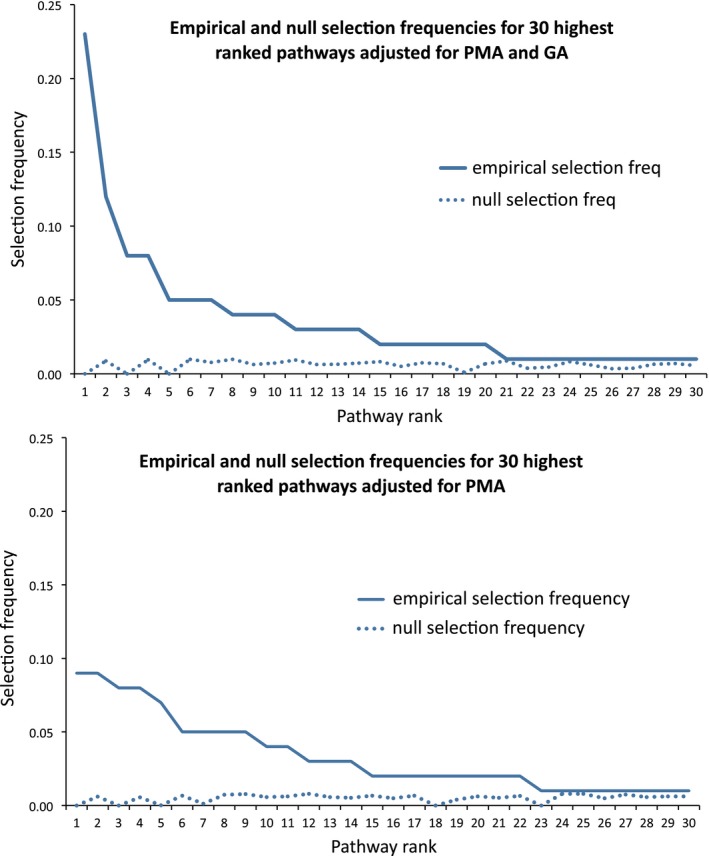
Empirical and null selection frequencies for thirty most predictive pathways, adjusted for PMA (top) and adjusted for GA and PMA (bottom).

Empirical and null selection frequencies for thirty most predictive pathways, adjusted for PMA (top) and adjusted for GA and PMA (bottom).