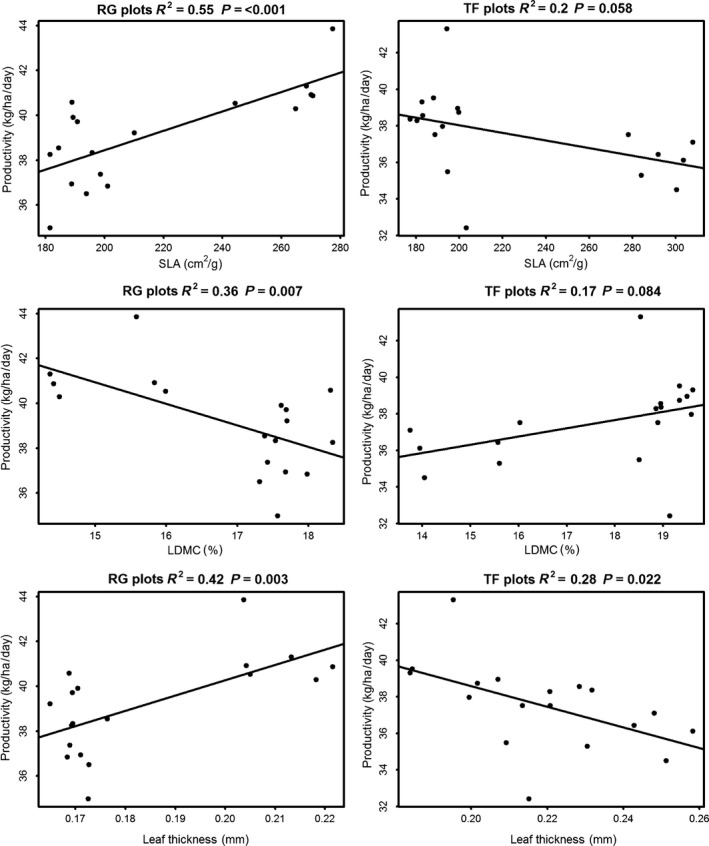
Figure 4.

Relationships between productivity and biomass‐weighted trait values for plot based on perennial ryegrass (RG plots) or by tall fescue (TF plots). R‐square and P values are from jack‐knifed linear regression. “SLA” is specific leaf area and “LDMC” is leaf dry matter content.
