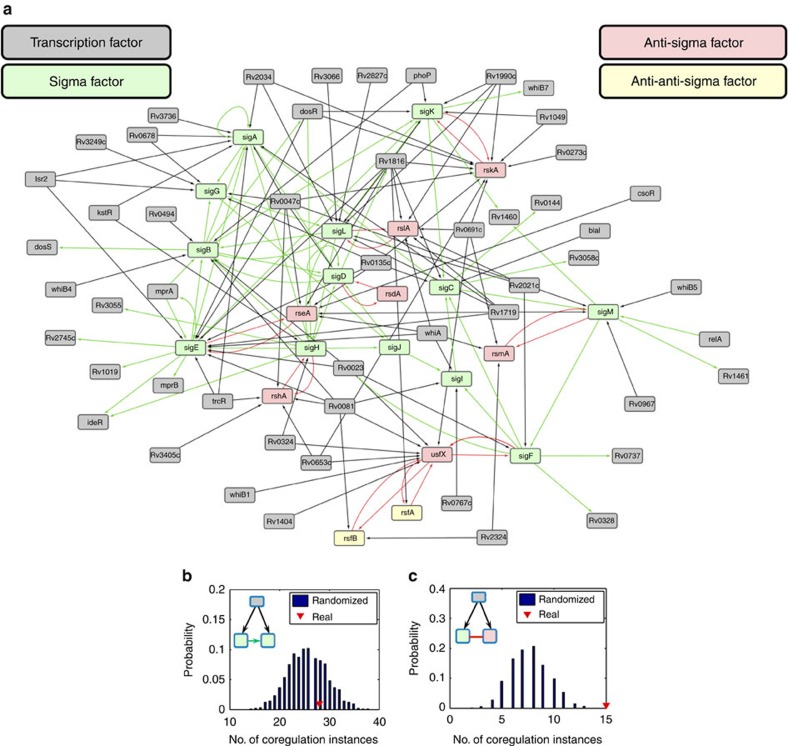
Figure 7. Embedding the sigma factor regulatory network into the transcription-regulatory network of M. tuberculosis.
(a) Transcription-regulatory neighbourhood of the sigma factor network. Each rectangle represents a gene and its protein product. Colours: grey, transcription factors; green, sigma factors; red, anti-sigma factors; yellow, anti-anti-sigma factors. Arrowheads indicate the direction of the regulatory links. (b) Number of occurrences for the network structure (inset) where a transcription factor regulates two sigma factors, one of which also regulates the other. Red triangle: actual number of occurrences; blue bars: distribution of occurrences in randomized networks. (c) Number of occurrences for the network structure (inset) where a transcription factor regulates a sigma factor and its corresponding anti-sigma factor. Red triangle and blue bars are as in panel (b).

