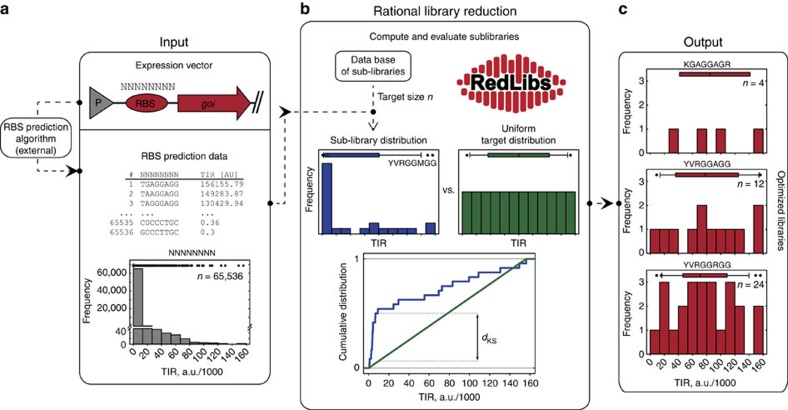
Figure 2. Rational library reduction by RedLibs.
(a) An externally produced comprehensive input data set for a fully degenerate RBS library (consisting of a nucleotides, here a=8) for a specific gene of interest (goi, here exemplified with mCherry) contains n=4a (65,536) sequence TIR (translation initiation rate) pairs with a strong skew to low TIR levels. (b) Based on this input data set RedLibs compares the TIR distributions of all possible sub-libraries of a user-defined size, which are organized in a database, with a desired target distribution (here: uniform) using the Kolmogorov–Smirnov distance dKS. (c) As an output the user receives a list of optimized sub-libraries (i.e., the 10 sub-libraries with the smallest dKS) along with the corresponding degenerate sequence for experimental implementation (shown here for mCherry and target sizes of 4, 12 and 24). The respective degenerate and explicit bases are given according to the 15-letter IUPAC nucleotide code. The boxplots over the histograms represent the median (box centre) and first/third quartile (box width) for the respective distribution with 10/90 percentiles displayed as whiskers and outliers as dots.

