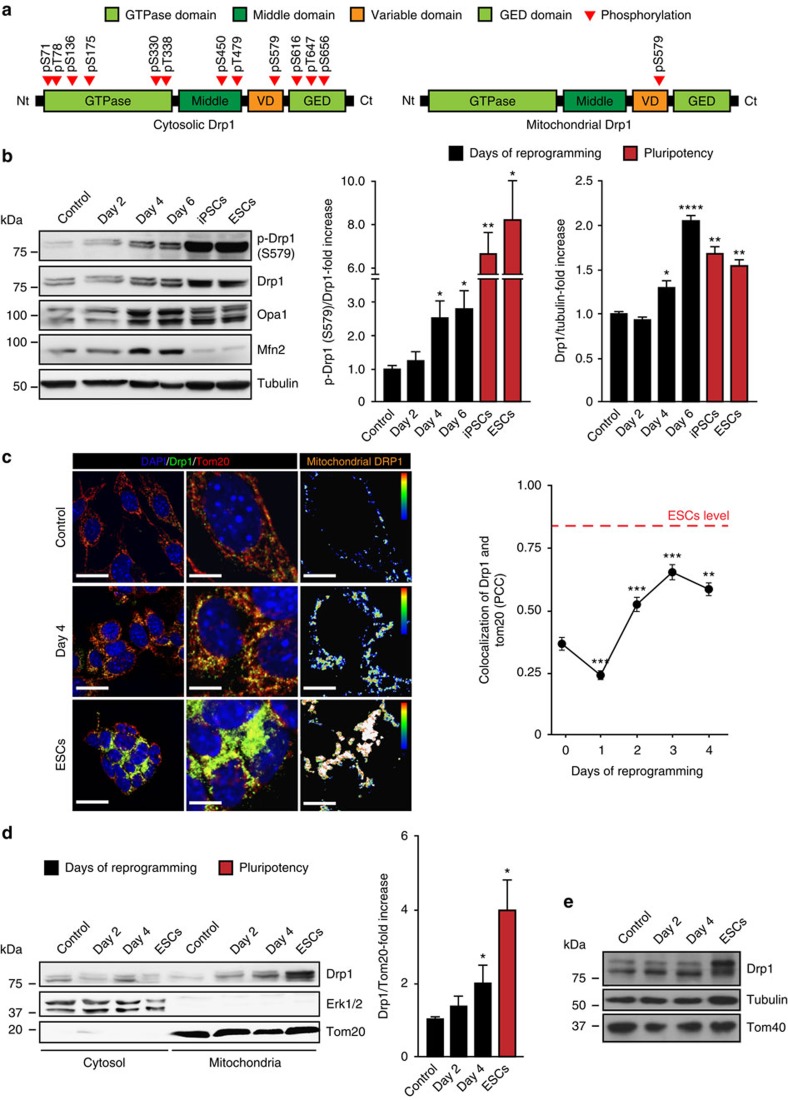
Figure 4. OSKM-induced Drp1 phosphorylation at serine 579.
(a) Diagram depicting the identified phosphorylated residues in cytosolic- (left) or mitochondria- (right) associated Drp1 in self-renewing ES cells by LC-MS/MS. (b) Lysates of mock- or OSKM-transduced MEFs for the indicated days, or the specified pluripotent cells were analysed by immunoblotting using the indicated antibodies. Graphs on the right show the quantification of the indicated ratios (n=3). (c) Representative confocal images of MEFs before (control, upper) or 4 days after OSKM expression (day 4, middle), or ES cells (ESCs, lower) stained with anti-Drp1 (green) or anti-Tom20 (red) antibodies. DAPI (blue) was used as a nuclear counterstaining. (middle) Magnification of the pictures on the left. Rightmost pictures are colour map representations of the pictures in the middle panels to display colocalized pixels between both fluorophores according to the displayed colour bar. Warm colours depict pixels with highly correlated intensity and spatial overlap while cold colours are indicative of random or anti-correlation. Scale bars, 24 μm (left); scale bar, 12 μm (middle); and scale bar, 12 μm (right). Graph on the right shows the quantification of the PCC to display the degree of colocalization between Drp1 and Tom20 at the indicated days of reprogramming. Red dashed line indicates the levels of Drp1 and Tom20 colocalization found in ES cells (n=3). (d) Cells treated as in b were lysed at the indicated days and fractionated into cytosolic or mitochondrial subcellular fractions. Then, subcellular fractions were subjected to immunoblotting analysis using the indicated antibodies. Graph shows the quantification of the Drp1/Tom20 co-fractionation ratio in the mitochondrial fraction (n=3). (e) Immunoblot showing the amount of the indicated proteins in total lysates from cells used for subcellular fractionation as control. Data are represented as mean±s.e.m. (*P<0.05, **P<0.01, ***P<0.001, ****P<0.0001). One-tailed unpaired Student's t-test was used to compare data sets. LC-MS/MS, liquid chromatography with tandem mass spectrometry.

