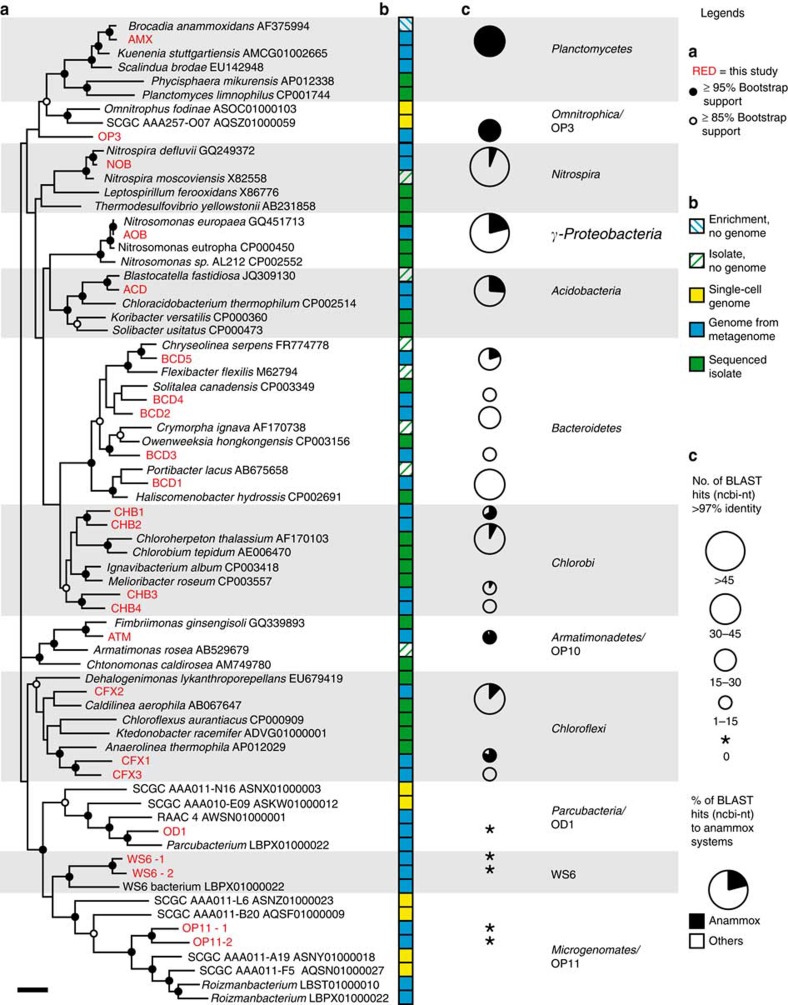
Figure 2. Phylogeny and previous detection of the 23 dominant organisms.
(a) 16S rRNA gene phylogeny of the obtained genomes and selected related organisms. Organisms in red were obtained in this study. Phylum level lineages (and the class Gammaproteobacteria) are indicated by background shading. Scale bar represents 10% sequence divergence. (b) Availability of isolate and/or genome for each organism in the tree. (c) Previous detection of the organisms obtained in this study using BLAST against the NCBI-nt and their occurrence in other aerobic or anaerobic anammox systems. Data are available in Supplementary Table 3.

