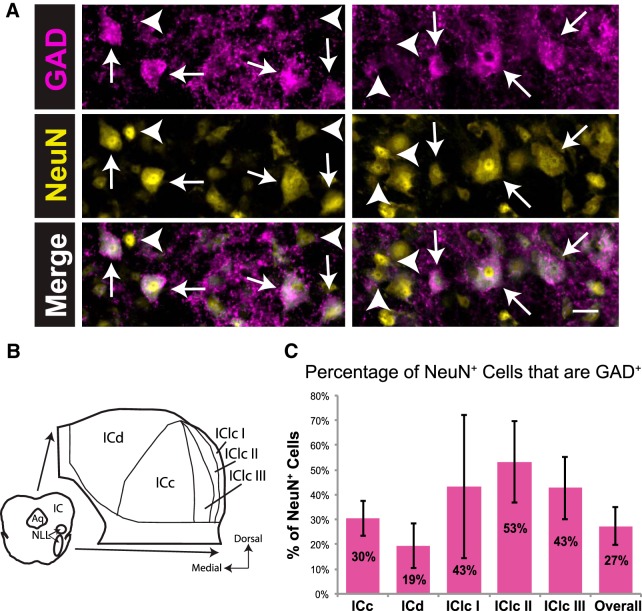
Figure 1.
GAD+ and GAD− neurons are present throughout the IC. A, Photographs of GAD+ neurons (arrows) and GAD− neurons (arrowheads) in the ICc (left column) and the IClc (right column). Scale bar, 20 μm. B, A schematic of a representative section showing the three main subdivisions of the IC, as well as the three layers of the IClc. Aq, Cerebral aqueduct; I, II, and III, layers of the IClc; NLL, nuclei of the lateral lemniscus. C, Bar graph showing the percentage of NeuN+ neurons that are GAD+ in each IC subdivision and overall. The percentage is highest in IClc layer II and lowest in the ICd. Error bars indicate 1 SD. Total sample size, 28,607 neurons. Sample sizes for subdivisions: ICc, 10,514; ICd, 14,023; IClc I, 406; IClc II, 1480; IClc III, 2184.

