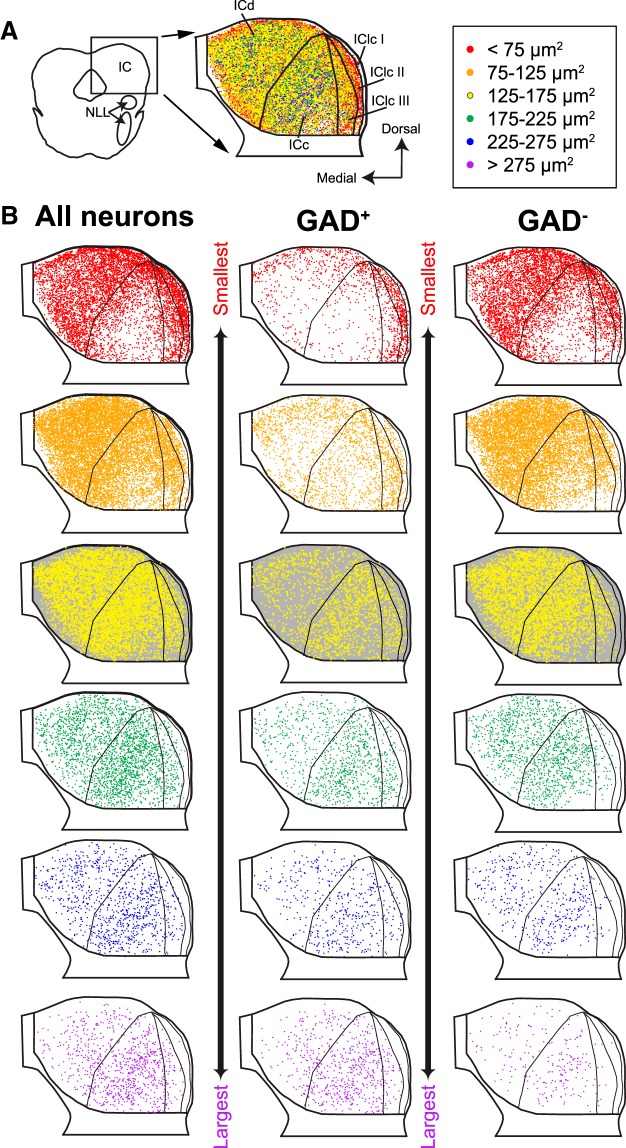
Figure 2.
Neurons of different profile areas differ in their distribution within the IC. A, Composite plot with all NeuN+ neurons from eight transverse sections through the IC. Soma locations were normalized to overlay sections (see Materials and Methods). Dorsal is up, and medial is left. Subdivision outlines from one representative section are shown for reference. On the right is a legend showing the soma size categories represented by each marker color. Red markers indicate the smallest somatic profiles (<75 μm2), and purple markers indicate the largest somatic profiles (>275 μm2), with intermediate colors indicating groups with a range of 50 μm2. I, II, and III, Layers of the IClc; NLL, nuclei of the lateral lemniscus. B, Distribution of all NeuN+ neurons (left column), GAD+ neurons (center column), or GAD− neurons (right column), separated by soma size categories: the smallest neurons are represented at the top and the largest at the bottom. The background in row 3 was colored gray to enhance visibility of the yellow markers.

