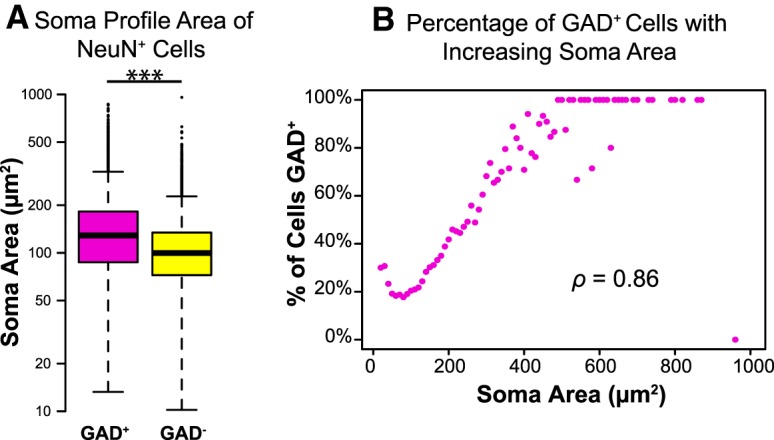
Figure 3.

GAD+ neurons are larger, on average, than GAD− neurons. A, Box and whisker plot showing the range and median of soma profile area for GAD+ (magenta) and GAD− (yellow) neurons. The box indicates the interquartile range (and thus contains the central 50% of the values), a bold horizontal line in the box indicates the median, and the 95% confidence intervals are indicated by the whiskers. Circles beyond the whiskers indicate outliers. Both GAD+ and GAD− neurons represent a range of sizes, but GAD+ neurons are significantly larger, on average, than GAD− neurons. ***p < 0.001. Note that the y-axis is scaled logarithmically. Sample sizes: 7575 GAD+ neurons and 21,032 GAD− neurons. B, Plot showing the percentage of neurons that are GAD+ as a function of soma area. Areas were binned in 10 μm2 increments. The percentage of neurons that are GAD+ increases with increasing soma size, and the two parameters are significantly correlated.
