Figure 5.
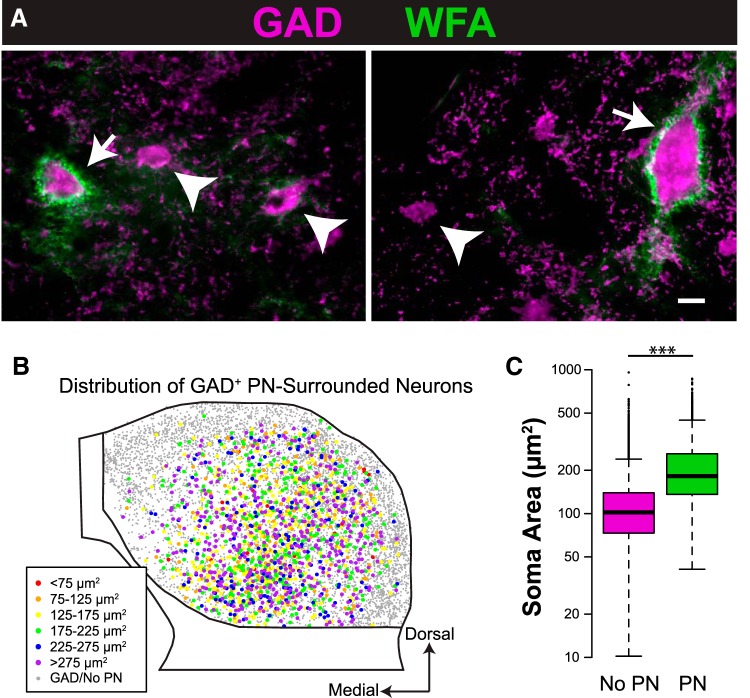
GAD+ neurons surrounded by PNs are larger, on average, than those lacking PNs. A, Photographs of GAD+ neurons of a range of sizes surrounded by (arrows) or lacking (arrowheads) PNs. Scale bar, 10 μm. B, A composite plot showing all GAD+ neurons from eight IC sections, similar to Figure 2, but with colored markers representing only GAD+ neurons surrounded by PNs. Smaller gray markers represent GAD+ neurons lacking PNs. Note that many GAD+ neurons with PNs are in the largest size category, with somatic profile areas >275 μm2 (purple markers). C, Box and whisker plot showing the range and median of soma areas for GAD+ neurons without (magenta) and with (green) PNs. GAD+ neurons with PNs are larger on average than GAD+ neurons lacking PNs. ***p < 0.001.

