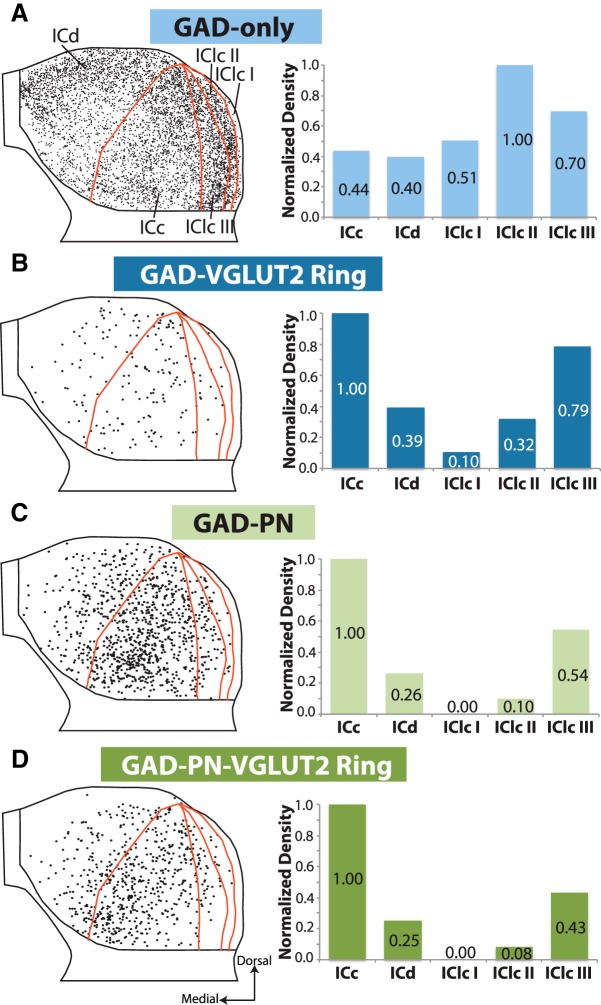
Figure 7.
Four subtypes of GAD+ neurons differ in distribution. A–D, Composite plots showing all GAD+ neurons from eight IC sections, with each GAD subtype shown in a separate panel. For each, the composite plot shows all neurons of that subtype, with subdivision outlines from one representative case for reference. GAD-only neurons (A) are denser in IClc, whereas GAD–PN and GAD–PN–VGLUT2 ring neurons (C, D) cluster in the ventromedial part of central IC. There is no definitive clustering of GAD–VGLUT2 ring neurons (B). To the right of each composite plot, a bar graph shows the normalized average density (cells per square millimeter divided by the maximum) for each GAD subtype across IC subdivisions.

