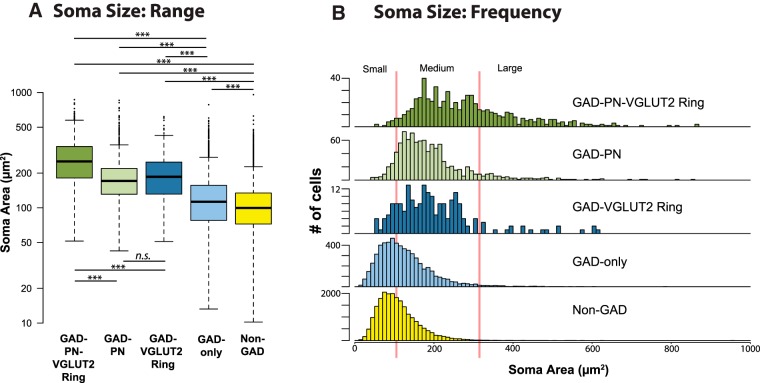
Figure 8.
Four subtypes of GAD+ neurons differ in soma profile area. A, Box and whisker plot showing the soma profile area range and median for GAD− neurons (yellow), as well as each GAD subtype. GAD-only neurons (light blue) are significantly smaller than GAD+ neurons in the other groups, whereas GAD–PN–VGLUT2 ring neurons (dark green) are significantly larger than GAD+ neurons in other groups. GAD− neurons are significantly smaller than all four groups of GAD+ neurons. ***p < 0.001. B, Frequency distributions of soma profile area for each of the GAD+ subtypes, as well as GAD− neurons. Vertical red lines indicate the soma size classification scheme proposed in this study for IC GAD+ neurons (small, <105 μm2; medium, 105–318 μm2; large, >318 μm2).

