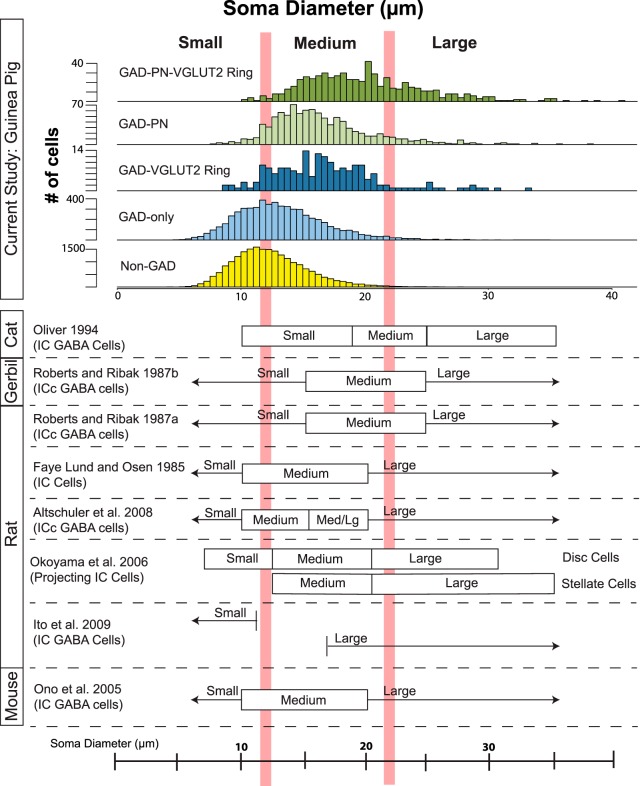
Figure 9.
Average soma diameter of neuron types in this study compared with IC cell size classifications from previous studies. The top shows histograms of average soma diameters for each GAD+ subtype and for GAD− neurons from the present study. Vertical red lines indicate the soma size classification scheme proposed in this study (small, <12 μm; medium, 12–22 μm; and large, >22 μm). In the bottom, each row indicates a previous study that used soma diameter to classify IC cells. Filled boxes indicate finite ranges, and arrows indicate unbounded classification windows (i.e., < or >).

