Figure 4.
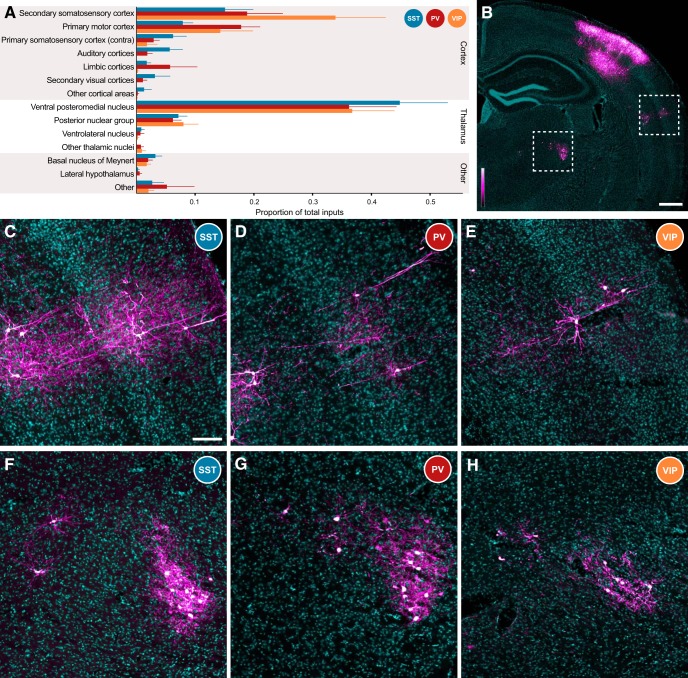
Distribution of brain-wide inputs to cortical interneurons. A, Overall, proportional input to all three interneuron classes was similar. All three interneuron types received inputs from secondary somatosensory cortex (S2), primary motor cortex (M1), and contralateral primary somatosensory cortex (S1BF), the major sources of long-range corticocortical input to S1. All three classes also received similar proportions of input from the VPm and the Po, the primary and secondary thalamic nuclei known to project into S1. Other minor input streams, such as innervation from the basal nucleus of Meynert, were also detected. Thick bars depict mean proportion of inputs, and thin lines indicate +1 SEM. B, Low-magnification depiction of a brain slice from a PV-Cre mouse. S2 is indicated by the dashed box at the far right, and is depicted at higher magnification for all three mouse lines in C–E. A region of thalamus, including nuclei VPm and Po, is outlined by the dashed box to the left, and is explored at higher magnification in F–H. RV signal is depicted with a custom magenta-hot lookup table (see lookup table to bottom left), and DAPI is in cyan. This is consistent across all panels. Scale bar, 500 μm. C–E, S2 inputs to S1 interneurons are largely detected in deep layer 3, layer 5A, and along the border between layers 5B and 6. Although in the images depicted cortical inputs are most numerous in the SST-Cre line (C), the overall proportion of inputs is similar across the PV-Cre (D) and VIP-Cre (E) lines. Scale bar: (in C) C–H, 100 μm. F–H, Thalamic inputs to S1 interneurons are present in both Po (left) and VPm (right), with many more cells within the boundaries of VPm. Again, total inputs depicted to SST (F) interneurons are most numerous, but the overall proportion of inputs is consistent across the PV-Cre (G) and VIP-Cre (H) lines.

