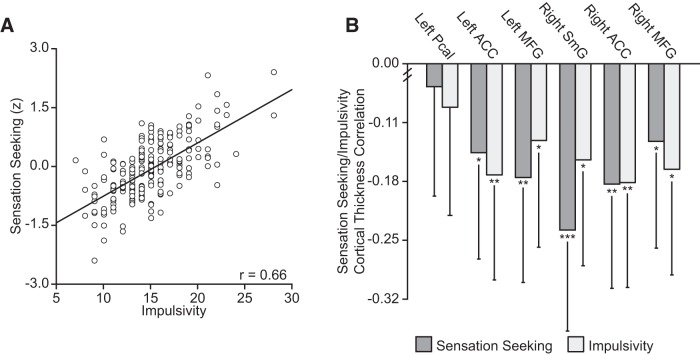
Figure 4.
Cortical correlates of sensation seeking and motor impulsivity replicate in an independent sample. A, Scatter plot displaying the correlation between sensation seeking and motor impulsivity (n = 219). B, Relations between sensation seeking and the mean cortical thickness in regions emerging from initial analyses (n = 1015) in a replication sample (n = 219). Note that all cortical regions are replicated except Pcal. Pcal, Pericalcarine cortex; MFG, middle frontal gyrus; SmG, supramarginal gyrus. Error bars indicate 95% confidence intervals. *p < 0.05, **p < 0.01, ***p < 0.001.

