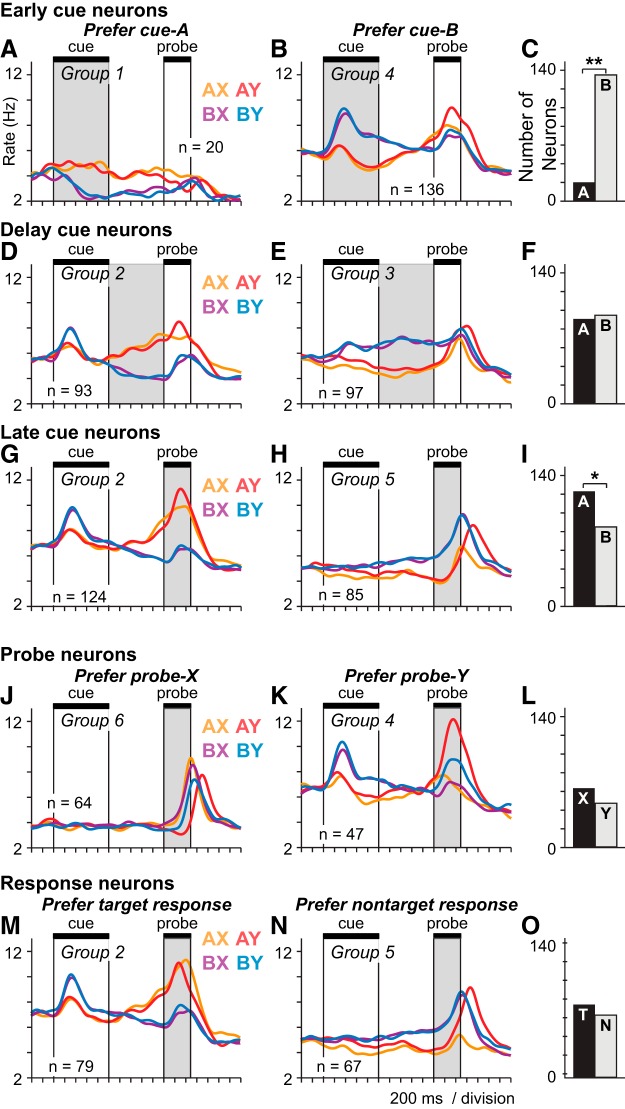
Figure 3.
Prefrontal population activity patterns encoding the cue, probe, and response. ANCOVA was used to identify populations of neurons with activity varying significantly (p < 0.05) as a function of the cue (A vs B), the probe (X vs Y) or the response (target vs nontarget), during different periods of the DPX trial. Gray represents the trial period used to classify neurons by ANCOVA. Trials are restricted to the balanced trial sets to illustrate the neural data entered into the ANCOVA. Neurons are limited to those recorded on both balanced and prepotent sets in this figure; counts differ slightly from those in Fig. 2C. SDF (σ = 40 ms) of different colors illustrate the average activity time course of each population broken out into four trial groups based on the cue-probe sequence: orange represents AX; red represents AY; purple represents BX; blue represents BY. Neuronal populations defined by ANCOVA that had similar patterns of activity were collapsed into a single group as indicated by the group numbers in each panel. A, B, “Early cue” neurons as defined by ANCOVA preferring the A-cue (A) or B-cue (B) during the cue period (shaded gray). C, Counts of early cue neurons preferring A-cues (black bar) and B-cues (gray bar). D, E, “Delay cue” neurons as defined by ANCOVA preferring the A-cue (D) or B-cue (E) during the delay period (shaded gray). F, Counts of delay cue neurons preferring A-cues (black bar) and B-cues (gray bar). G, H, “Late cue” neurons as defined by ANCOVA preferring the A-cue (G) or B-cue (H) during the probe period (shaded gray). I, Counts of late cue neurons preferring A-cues (black bar) and B-cues (gray bar). J, K, “Probe” neurons as defined by ANCOVA preferring the X-probe (J) or Y-probe (K) during the probe period (shaded gray). L, Counts of probe neurons preferring X-probes (black bar) and Y-probes (gray bar). M, N, “Response” neurons as defined by ANCOVA preferring the target response (M) or nontarget response (N) during the response period. O, Counts of response neurons preferring target responses (black bar) and nontarget responses (gray bar). Asterisks above bar charts indicate a significant bias in the number of neurons preferring A- versus B-cues, X- versus Y-probes, and target versus nontarget responses: *p < 0.05; **p < 0.01.

