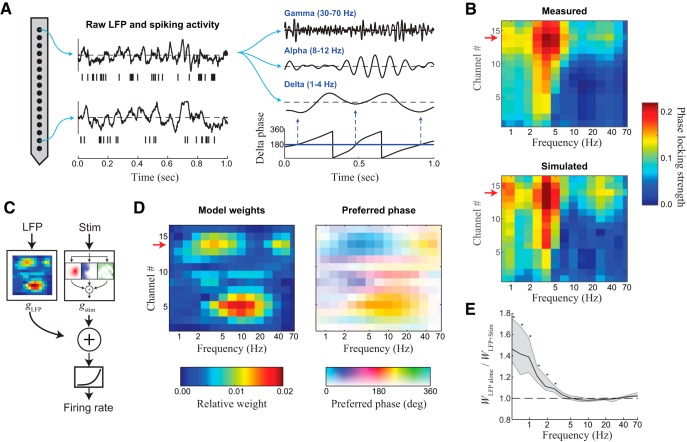
Figure 2.
Predicting MT responses from the stimulus and inferred network activity. A, Time–frequency analysis of the LFPs. Left, LFP signals and spiking activity were recorded with a 16-channel multielectrode array and used as inputs to a model that predicts a given single unit on the array (described below). Middle, To illustrate how each LFP was processed for use in the model, we show an LFP segment bandpassed in the gamma (30–70 Hz), alpha (8–12 Hz), and delta (1–4 Hz) bands. Right, To process each LFP for input to our model, we use a continuous wavelet transform to decompose the LFP signal into its amplitude and phase in each frequency band. To demonstrate how phase relates to a given bandpassed signal, the delta phase is shown below the delta band-filtered LFP (bottom middle); with times that phase is 180° (blue arrows) corresponding to local minima in the bandpassed signal. B, The phase-locking strength measured across frequency band and depth for an example neuron (top), demonstrating sensitivity in the delta and gamma bands. The phase-locking strength of simulated spikes generated by the LFP model (bottom) is nearly identical, demonstrating how the localized model components in D combine with correlations between LFP band and depth to result in empirical phase-locking measurements. C, Schematic of the LFP model, which includes a stimulus-processing component (from Fig. 1B), and the LFP-based component. D, Example LFP model component. Model weights (left) and preferred phases (right) are displayed as a function of both frequency bands (horizontal axis) and cortical depth (vertical axis). Phase values are depicted by hue, with the color brightness representing the corresponding weights to emphasize frequency bands and depths that are most important. E, To determine the effect of simultaneously fitting multiple model components, we measured the ratio of model weights for single-electrode LFP models fit with and without the stimulus-processing model. This shows that LFP models fit without the stimulus-processing component typically have much larger weights in low-frequency bands (<4 Hz, *p < 0.001, n = 108).

