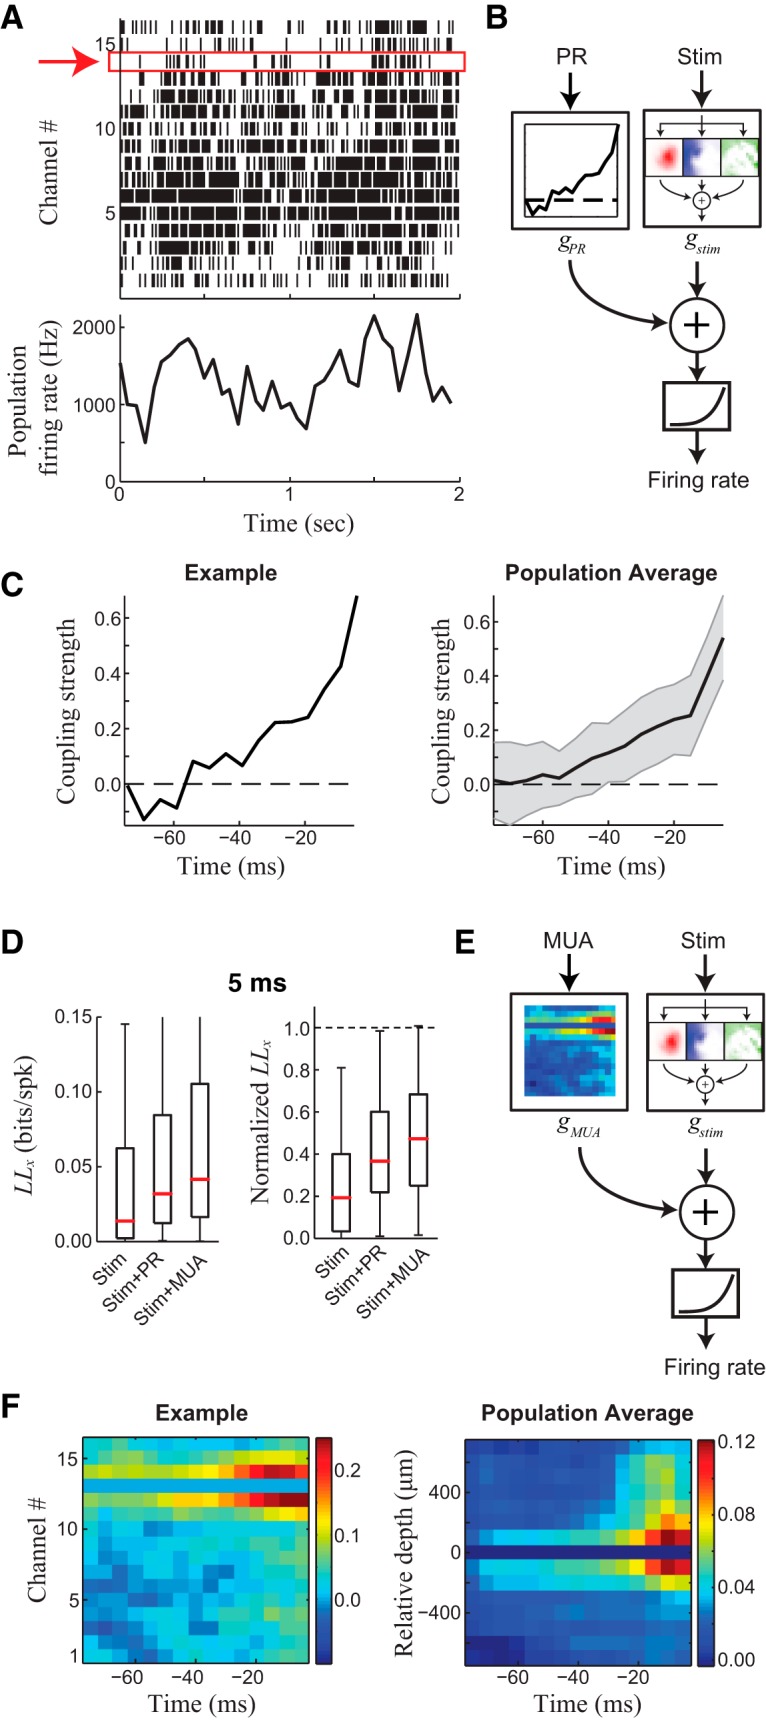
Figure 5.

Modeling MT neuron response with multiunit activity. A, Example multiunit spiking activity (MUA, top) and the resulting population firing rate (PR; bottom) recorded from the multielectrode array, with the red box highlighting the single unit being modeled (which was excluded from the model). B, Schematic of the population rate model, which sum the output of PR-based and stimulus-processing components, passing the result through a spiking nonlinearity. The contribution of the PR was modeled using a linear temporal filter applied to the recent history of PR. C, Left, A typical PR filter, showing coupling between the example neuron and PR as a function of time lag (horizontal axis). Right, Average of all PR model components across the population of recorded neurons (n = 93). D, Left, The LLx of the PR and MUA models across the population of recorded neurons. Right, The same data, showing the normalized LLx across all neurons (as in Fig. 3), where the LLx of each model was normalized by the LLx of the best model for that neuron (see below). The normalized LLx is thus on the same scale as the LFP models considered earlier (Fig. 3), demonstrating that the PR-based models have less than half the performance of the LFP-based models. E, Schematic of the MUA model, where the MUA component replaces the PR component considered above (B). F, Left, A typical MUA model component, showing weights on MUA as a function of time lag (horizontal axis) and electrode depth (vertical axis) for the same neuron as the example in the top left panel in B. Right, Average of all MUA model components across the population of recorded neurons.
