Figure 7.
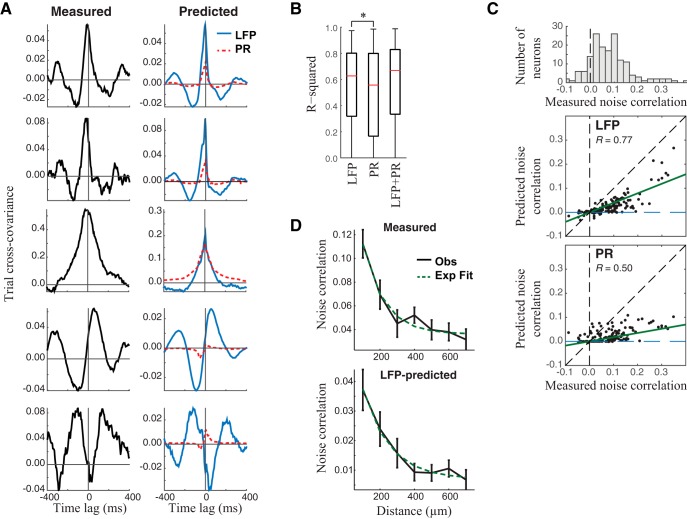
LFP signals predict noise correlation. A, Examples demonstrating a range of measured noise correlations between pairs of MT neurons (left), which largely match the shape of the noise correlations predicted by the LFP models fit separately to each neuron in the pair (right, blue), compared with the predictions of the PR model (dashed red). B, The correlation coefficients between measured and predicted noise correlation functions demonstrate that the LFP models are capturing the shape of the noise correlation functions (median, r = 0.63 ± 0.04). The PR model has significantly worse performance (median, r = 0.56 ± 0.06, p < 0.05), whereas the combined PR plus LFP model does not perform significantly better than the LFP model (median, r = 0.67 ± 0.04, p = 0.60). C, Top, Simultaneously recorded pairs of neurons had a range of noise correlations (histogram shown across all pairs). Middle, bottom, The LFP model could predict these correlations on a neuron-by-neuron basis (middle, r = 0.77), again with the PR model not achieving as high performance (bottom, r = 0.50). D, The LFP model also could predict the dependence of noise correlation on relative depth: measured noise correlation (top) declines as a function of distance between MT neuron pairs, which is captured by the LFP model (bottom). Dashed lines show exponential fits to this relationship.

