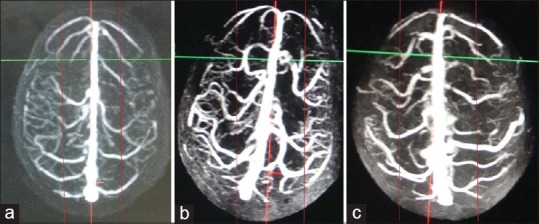
Figure 7.

Superior view three-dimensional contrast-enhanced magnetic resonance venogram of 3 different individuals (a-c) categorized into high-risk groups based on our risk stratification criteria. The posterior limit of anterior third of superior sagittal sinus has been marked with red arrows
