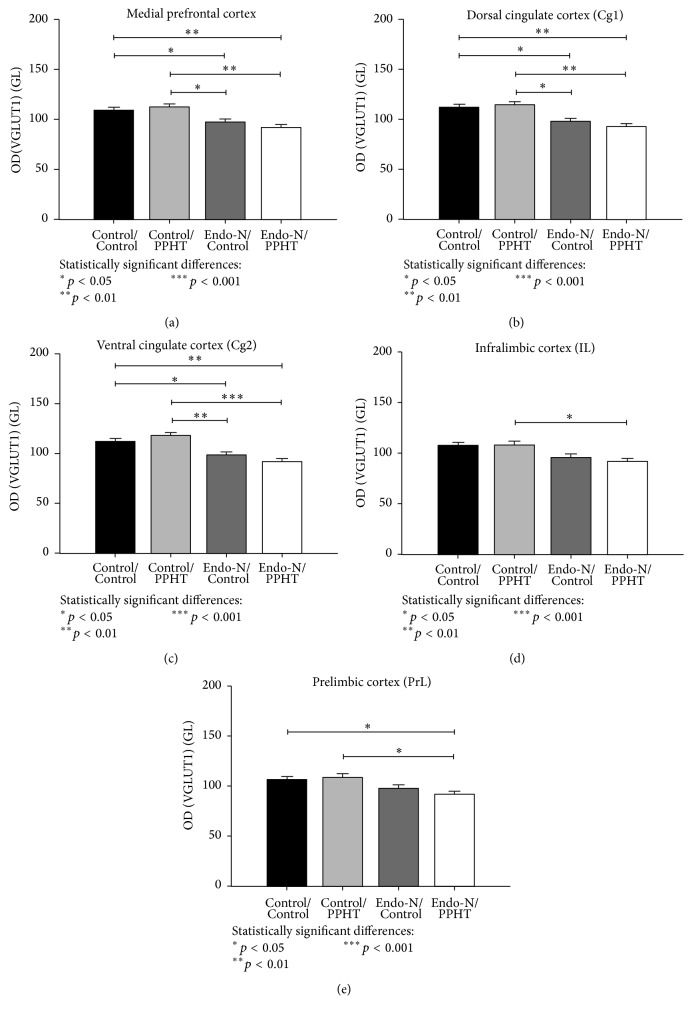
Figure 2.
Graphs showing changes in the neuropil of VGLUT1 in the mPFC (a), dorsal cingulate (b), ventral cingulate (c), infralimbic (d), and prelimbic (e) cortices after Endo-N and/or PPHT treatments. Three sections per animal (n = 6 animals/group) were examined under bright-field illumination, homogeneously lighted, and digitalized using a CCD camera at 20x magnification. Grey levels were converted to optical densities (OD) using Image J software (NIH) (see Materials and Methods). Error bars represent SEM and asterisks in bars indicate statistically significant differences between groups after univariate repeated measures ANOVA followed by multiple pairwise comparisons with Bonferroni's correction (∗ p < 0.05, ∗∗ p < 0.01, and ∗∗∗ p < 0.001).

