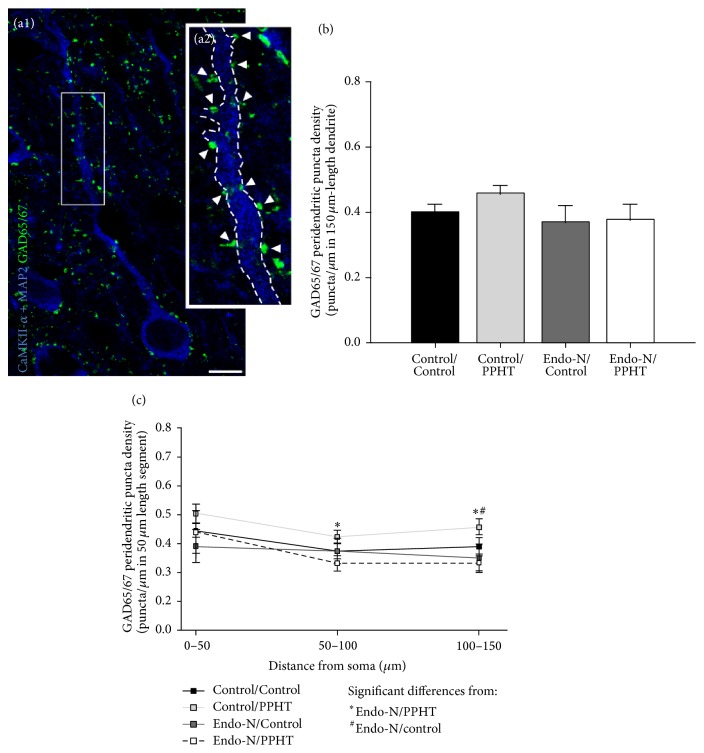
Figure 5.
Confocal microscopic analysis of GAD65/67 expressing puncta in the peridendritic region of mPFC pyramidal neurons after Endo-N or PPHT treatments and their combination. (a1-a2) Single confocal planes showing a pyramidal neuron somata and its apical dendrite (immunolabeled for CaMKII-α and MAP2; blue color and marked with dashed line) innervated by GABAergic puncta (GAD65/67 immunoreactive puncta; green color and marked with arrowheads). (a2) is a 3x magnification of the squared section in (a1). Scale bar for (a1): 10 μm. (b) Graph showing no changes in the peridendritic density of GAD65/67 expressing puncta (puncta/μm) when considering the total length (200 μm) of the measured dendrites. (c) Graph representing GAD65/67 peridendritic puncta density as a function of distance from the soma in 50 μm length segments. In both graphs, 6 animals per group were analyzed. Error bars represent SEM and symbols in bars indicate statistically significant differences between groups after one-way ANOVA followed by Bonferroni's correction (see graph legend).

