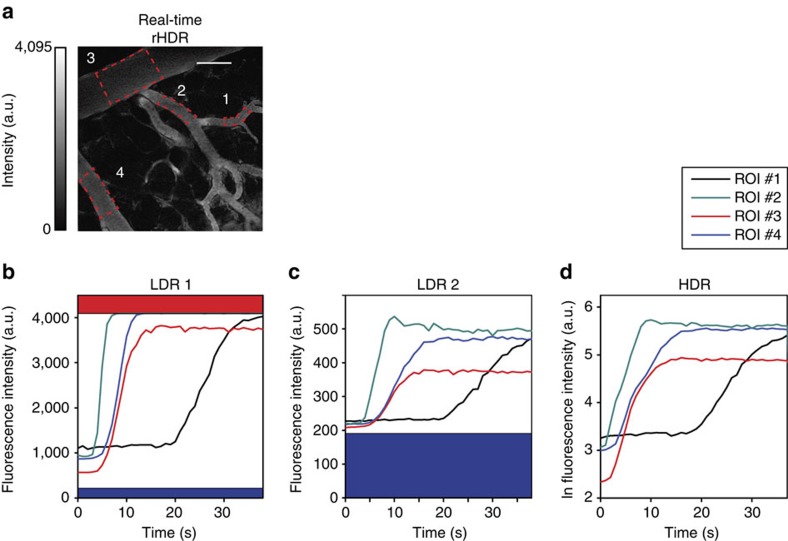
Figure 10. In vivo intravascular dye kinetics.
In vivo intravascular real-time quantification of the time–intensity variations demonstrating the vascular pharmacokinetics of a fluorescent probe across multiple regions of interests (ROIs). A bolus of 2 MDa FITC-Dextran was injected intravenously through the lateral tail vein (see ‘Methods' section) and vascular kinetics were captured by collecting a time sequence of real-time HDR images. (a) ROIs were selected in several blood vessels within a dorsal window chamber and time–intensity curves calculated as the mean of the signal within the ROI as a function of time. (b–d) Time–intensity curves are plotted for both (b,c) LDR and (d) HDR time sequences. LDR sequences have a limited ability to capture the full dynamic range of intensities, while HDR sequences present a high SNR and extended dynamic range demonstrating the ability to maintain imaging fidelity for kinetic quantification. Scale bar, 125 μm.

