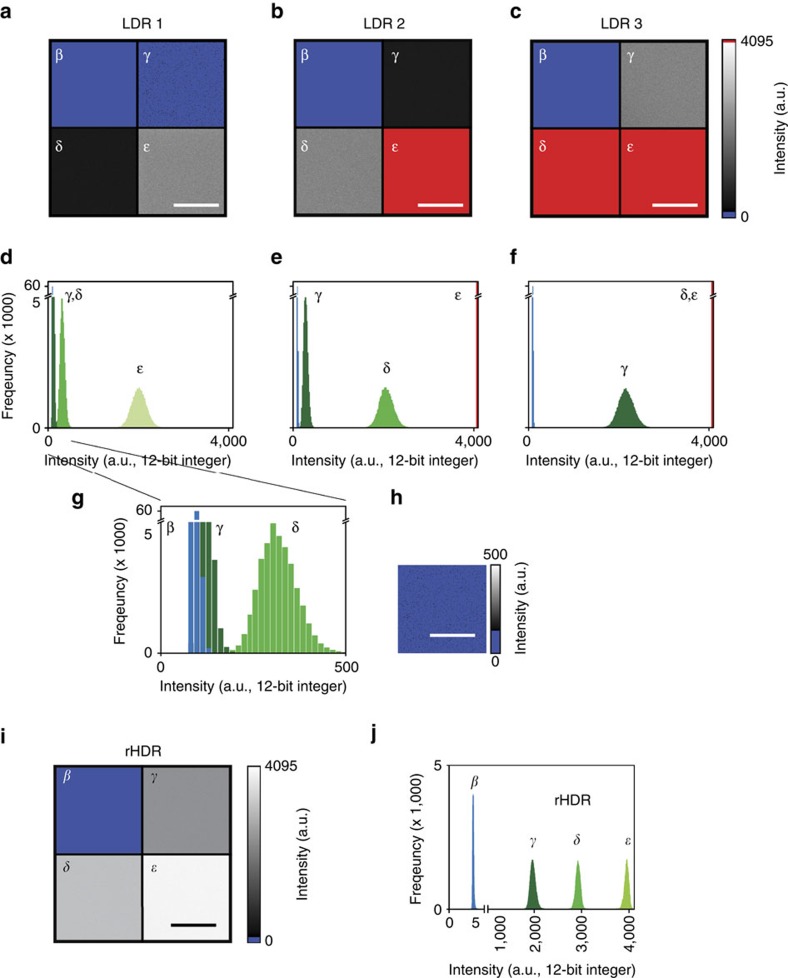
Figure 2. Imaging phantom.
(a–c) Three low dynamic range (LDR) fluorescence images with their relative histograms (d–f), of an imaging phantom composed of four distinct non-adjacent areas with different fluorophore concentrations (Supplementary Fig. 6 and ‘Methods' section), as measured from one detector with its dynamic range accurately centred around the maximum intensity of each specific region (γ, δ, ɛ). Region γ, dark green. Region δ, green. Region ɛ, light green. (g,h) In the non-saturated image (LDR1), the signal contribution from the region γ is buried within the noise with a low SNR (re-scaled subset image of region γ is shown in h. (i,j) Remapped HDR image (rHDR, compressed dynamic range for visualization) obtained combining the information from the three different LDR images and displayed with a dynamic range compression mapping algorithm (‘Methods' section and Supplementary Note 2), along with its corresponding histogram. The dark noise image (region β) is the same for all phantom's mosaicked images a–c. The blue colormap threshold for the dark noise is set at the maximum of the dark noise signal. Image colour bar: blue, dark noise; red, saturation levels. Scale bar, 50 μm.

