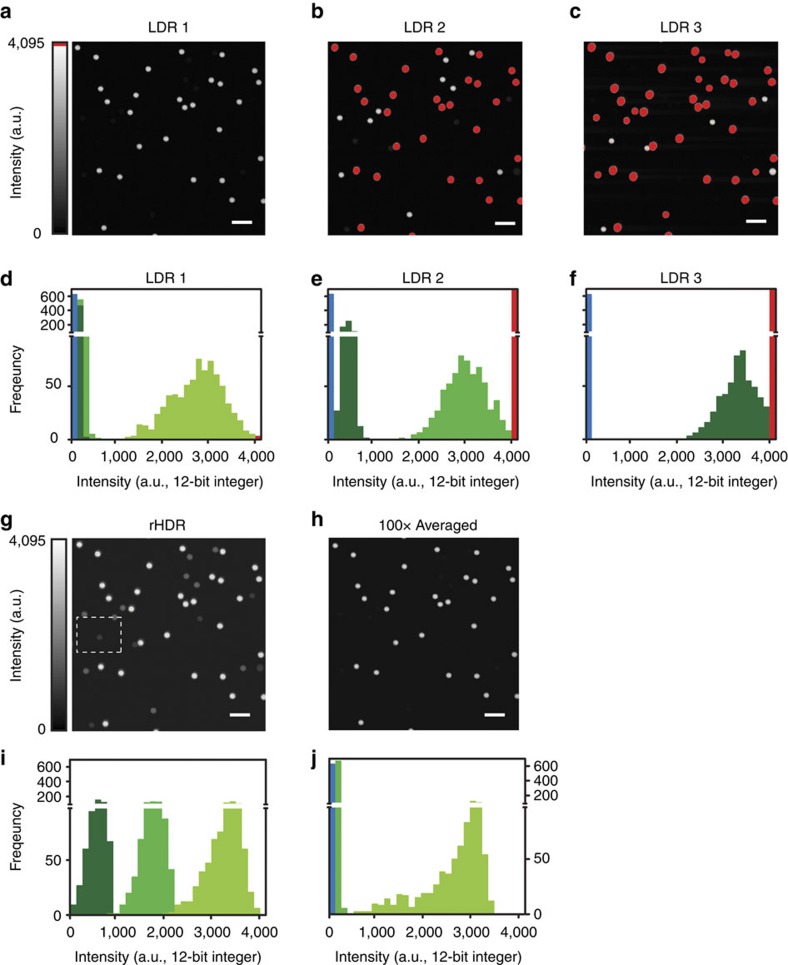
Figure 3. Microspheres HDR two-photon imaging.
(a–c) Low dynamic range fluorescence images and (d–f) relative histograms of a mixture of three fluorescent microspheres populations with three different discrete values of fluorescence concentrations (see ‘Methods' section) centred at different intensity signals within the digitizing range. Bead population 3, light green. Bead population 2, green. Bead population 1, dark green. (g) Remapped HDR image (rHDR, compressed dynamic range for visualization) and (h) averaged (100 ×) low intensity LDR1 image. (i,j) Corresponding histograms. Image colour bar: red, saturation levels. Scale bars, 10 μm.

