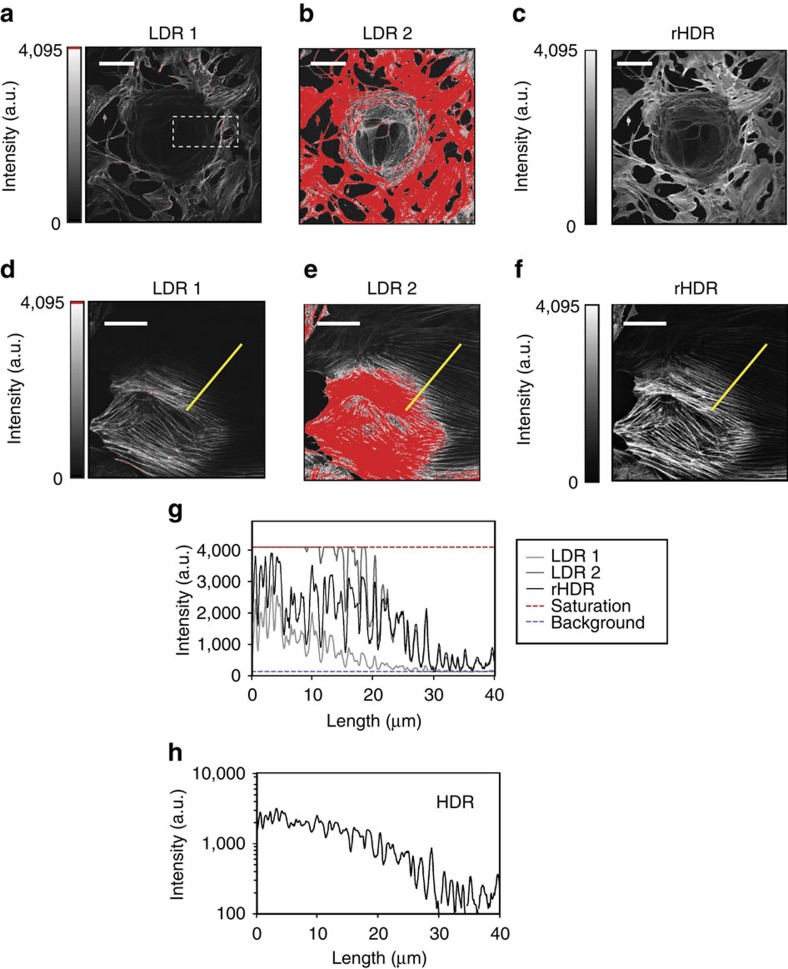
Figure 4. Cellular HDR two-photon and confocal imaging.
(a–f) Images of BS-C-1 cells stained for actin (see ‘Methods' section). Low (a,d) and high (b,e) LDR images and rHDR (c,f) images. Emphasis of the extended range at reduced scale is shown within the dashed box in Supplementary Fig. 27. (g,h) Actin fluorescence intensity along the profile indicated in d for for both LDRs, rHDR (g) and HDR (h) images. Scale bar (a), 100 μm. Scale bar (d–f), 20 μm.

