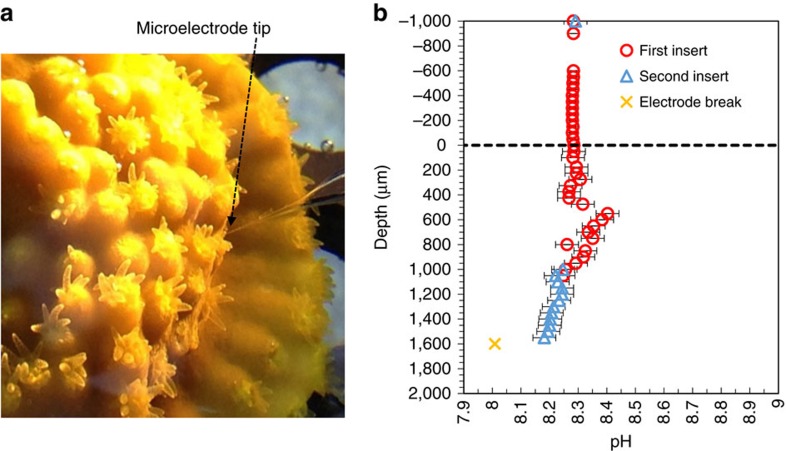
Figure 1. Microelectrode profiling and electrode performance.
(a) Close-up view of the coral T. reniformis showing the tip of a microelectrode as it enters the polyp. (b) Repeated pH microelectrode profile readings inside a T. reniformis coral polyp. Between the last point of the second insert and the next reading (which is a noise-free reading and is marked as ×), the microelectrode tip broke. pH microelectrodes were calibrated on the NBS scale, which is about 0.1–0.15 unit greater than that on the total scale. Error bars (s.d.) are defined in the Methods section. Positive depths are inside the coral polyp while negative depths are in the overlying seawater. Error bars are smaller than the symbols in the overlying water.

