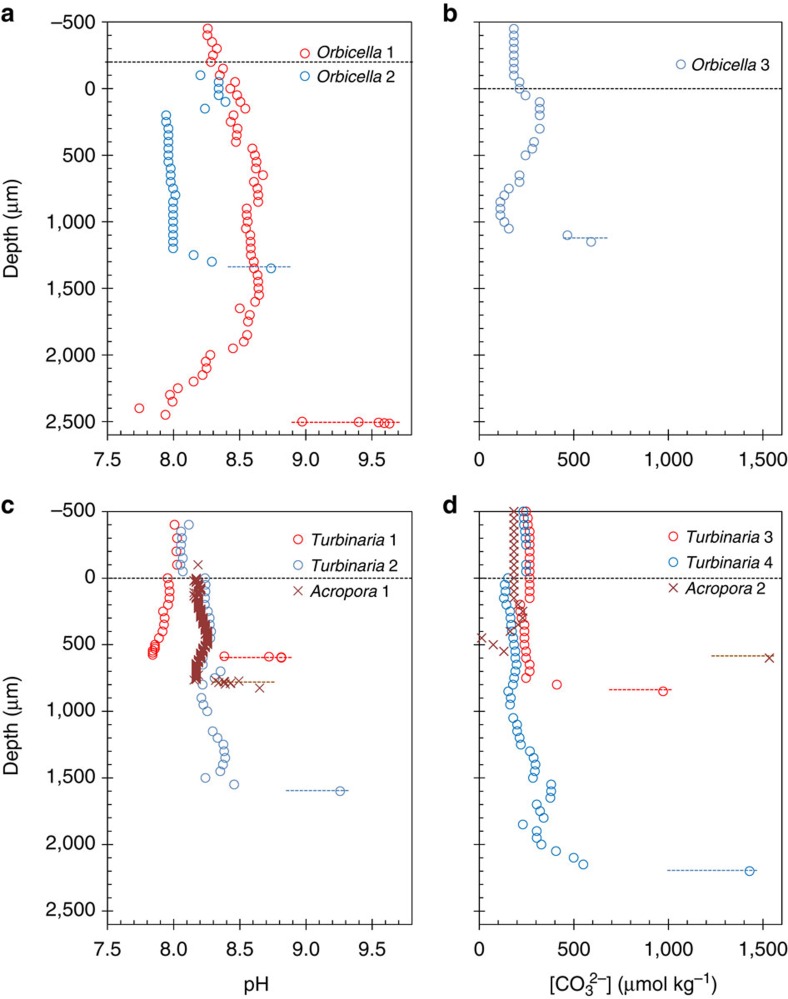
Figure 2. Coral internal pH and [CO32−] profiles through the polyp mouths.
(a) pH and (b) [CO32−] of Orbicella faveolata corals. (c) pH and (d) [CO32−] of Turbinaria reniformis and Acropora millepora corals. Dashed black lines indicate the top of the polyp mouths. Colored dashed lines roughly indicate the location of the calcifying fluid and differ in depth for each polyp.

