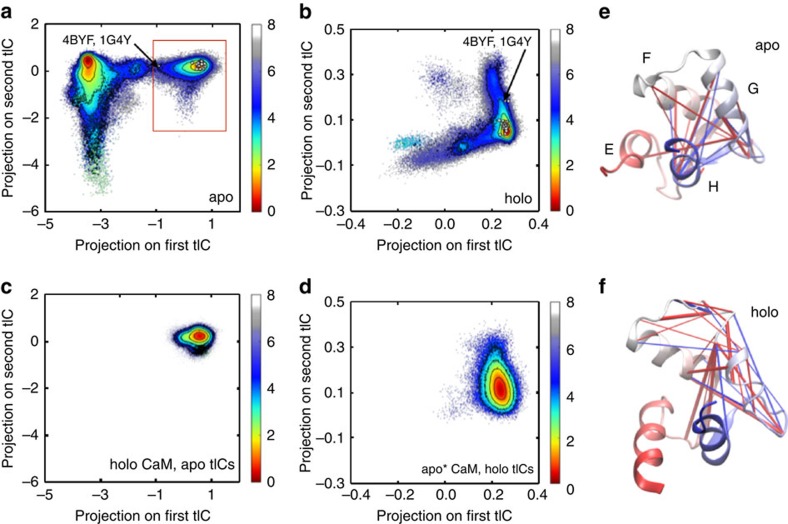
Figure 3. The top tICs capture distinct dynamic processes.
The energy landscapes of (a) apo- and (b) holo-C-CaM were generated by projecting the system's conformations, weighted by their MSM probabilities, onto their respective tICs. Comparison was made to available experimental structures by projecting the C-lobe of these published structures onto the relevant tICs (white dots). (c) Projection of the holo conformations on the apo tICs and (d) the holo-like basin in the apo system (boxed in red in a) on the holo tICs underscores their different dynamics. Free energy values are reported in kcal mol−1. The 25 inter-residue distances whose dynamics most contribute to the top (e) apo and (f) holo tIC are visualized on cartoon representations of the published structures of apo- and holo-C-CaM. Red and blue lines denote positive and negative tIC values, respectively.

