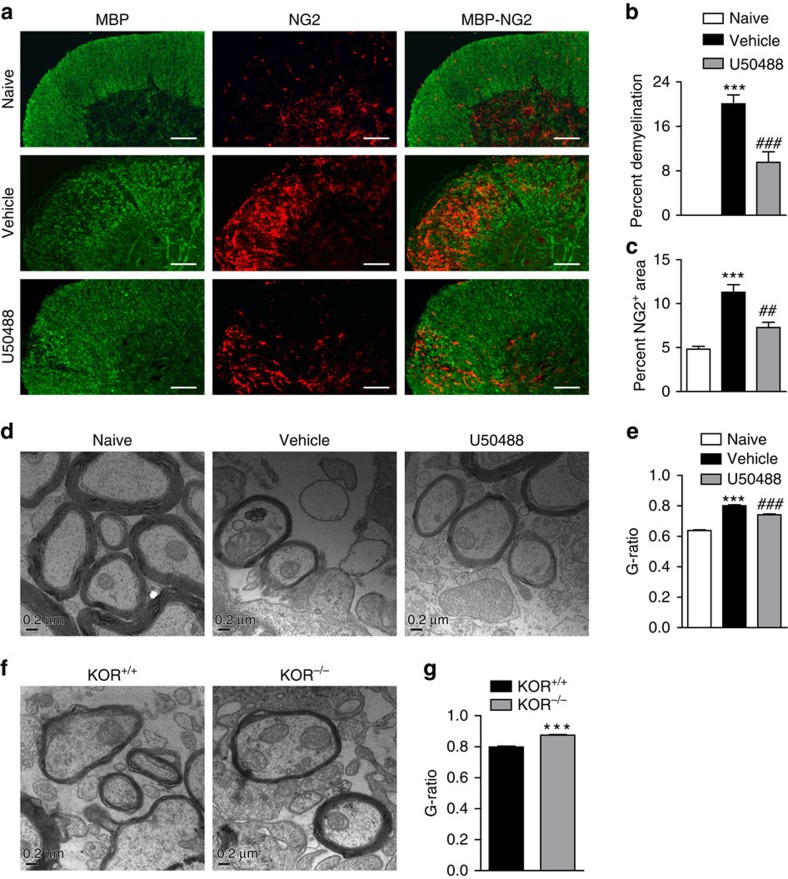
Figure 3. Activation of KOR promotes remyelination in EAE mice.
(a) Immunofluorescence staining of OLs (MBP) and OPC (NG2) in the spinal cords isolated on day 22 post immunization from WT-EAE mice treated with vehicle or U50488 (1.6 mg kg−1). Scale bars, 100 μm. (b,c) Statistical analysis of the demyelination area and NG2 positive area in white matter. Three animals from each group were killed and 15 sections of the spinal cord of each animal were analysed. Data are means±s.e.m. ***P<0.001 versus naive group, ##P<0.01, ###P<0.001 versus vehicle group (Student's t-test). (d) Representative electron microscopy images of cross sections of the spinal cords isolated from naive, vehicle or U50488 (1.6 mg kg−1)-treated EAE mice on day 22 post immunization. Scale bar, 0.2 μm. (e) G-ratios of spinal cord axons in d. Data are means±s.e.m. (n=200), ***P<0.001 versus naive, ###P<0.001 versus vehicle treatment (Student's t-test). (f) Representative electron microscopy images of spinal cords isolated from WT or KOR−/− EAE mice on day 22 post immunization. Scale bar, 0.2 μm. (g) G-ratios of spinal cord axons in f. Data are means±s.e.m. (n=200), ***P<0.001 versus KOR+/+ (Student's t-test).

