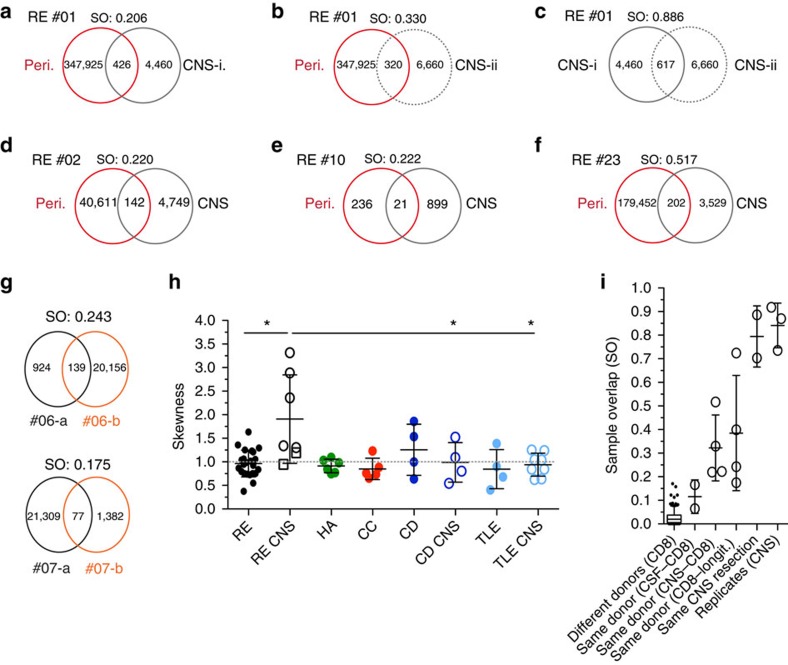
Figure 3. Expanded CD8+ T-cell clones shared between periphery and CNS.
Shown are four RE patients with corresponding periphery and CNS samples. From patient RE #01 two CNS tissue resections were available. The Venn diagrams show the productive uniques of each sample, their shared productive uniques (shared clonotypes/CD8+ T-cell clones), the SO and the top 10 shared clones of the respective sample comparison (given are amino-acid sequence, Vβ gene, Jβ gene and frequencies in the respective sample; clones are sorted by frequency in the CNS sample). (a) RE 01 CD8+ periphery and CNS-i (first tissue resection), (b) RE 01 CD8+ periphery and CNS-ii (second tissue resection), (c) RE 01 CNS-i and CNS-ii, (d) RE 02, (e) RE 10 and (f) RE 23. (g) Two RE patients where peripheral CD8+ T-cell samples were available 1 year apart (a and b), (h) the skewness of the different patient groups and compartments described in Figs 1 and 2 (RE per. black, n=23; RE CNS black, n=7; HA green, n=6; CC green, n=5; CD dark blue, n=4; CD CNS dark blue, n=4; TLE periphery (per). light blue, n=4; TLE CNS light blue, n=8). Closed circles indicate peripheral CD8+ T-cell samples, open circles indicate CNS tissue specimen and open squares indicate CSF samples (mean±s.d., unpaired t-test with Welch's correction). (i) Comparison of SOs between CD8+ compartments of different donors (n=231, longitudinally (longit.) whiskers: 5–95 percentile), CD8+ and CSF of the same donor (n=2), CD8 and CNS of the same donor (n=4), CD8+ from two time points and the same donor (n=4), two tissue resections of the same donor's brain tissue (n=2), and the same CNS sample sequenced twice independently (n=3) (mean±s.d.).

