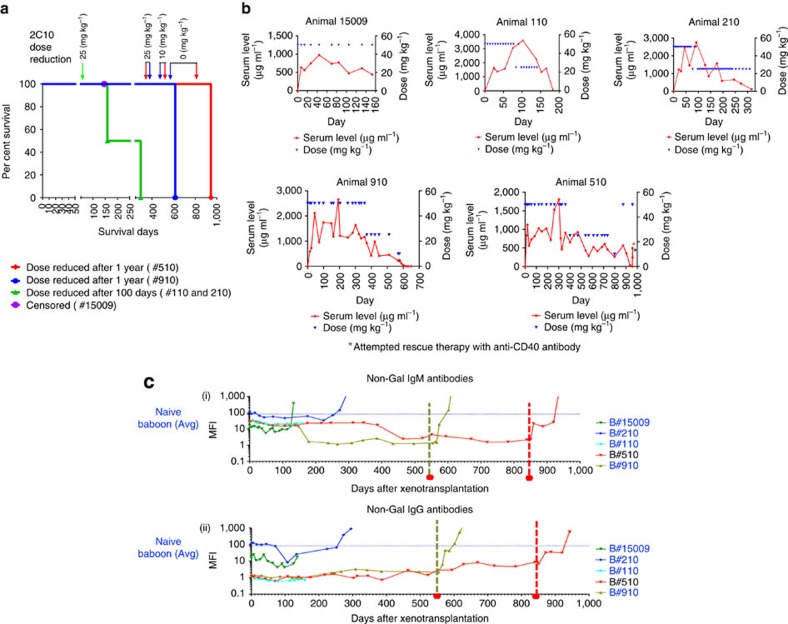
Figure 2. Cardiac xenograft survival.
(a) Survival graph showing cardiac xenograft survival for five baboons. It also indicates the time points when the 2C10R4 dose was reduced. The long-term graft survival in two animals is plotted separately to give clear idea of the time points for antibody dose reduction. In two animals, the dose was reduced to 25 mg kg−1 on day 100 (green arrow); in two long-term surviving animals dose reduction to 25 mg kg−1 was made after 1 year and the antibody treatment was terminated in #910 on day 560 (blue arrow) and in #510 on day 861 (red arrow). (b) Detection of 2C10R4 levels in the plasma of the transplanted baboons. A blue triangle represents each dose. (c) Non-Gal (both IgM and IgG) antibody production in all baboons. The green and red dashed lines indicate the day αCD40 antibody treatment was stopped for baboons #910 and 510, respectively.

