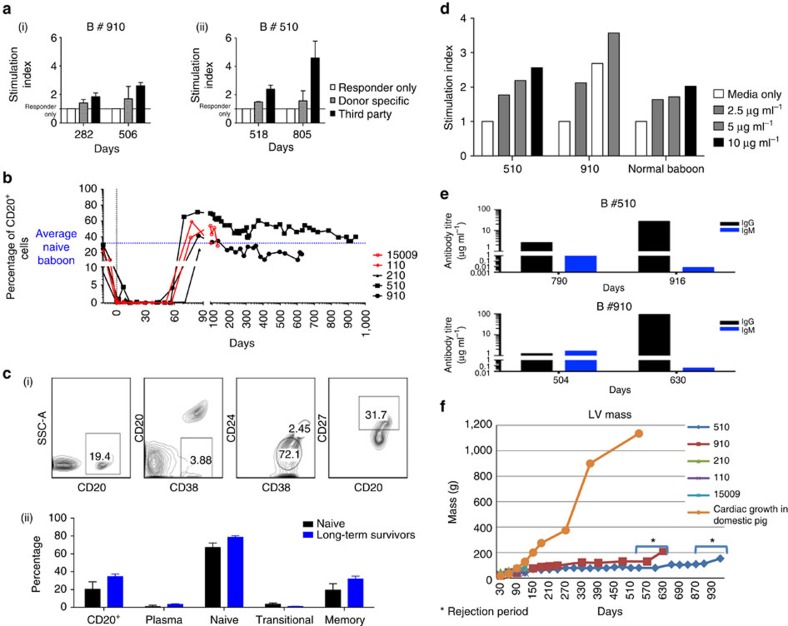
Figure 5. In vitro cellular assays.
(a) Mixed lymphocyte reaction of cells from baboons #910 (i) and #510 (ii). Two control specimens were used for each assay and each specimen was plated in triplicates; s.d. is also shown with bars. (b) Suppression of B-cell numbers in all five baboons for 60 days after αCD20 antibody treatment. (c)—(i) Describes the phenotypes of B lymphocytes from an untreated baboon; (ii) comparison of an untreated and experimental baboon (#510) phenotype with s.d. (d) Proliferation of B lymphocytes of naive, baboons #510 and #910 in response to human IgM antibody stimulation at one time point. (e) Antibody production from human IgM-stimulated B cells from long-term surviving baboons #510 and #910 at one time point. (f) The line graph demonstrates the rate of change in graft size in all five baboons. The time from termination of the 2C10R4 treatment to rejection is also indicated.

