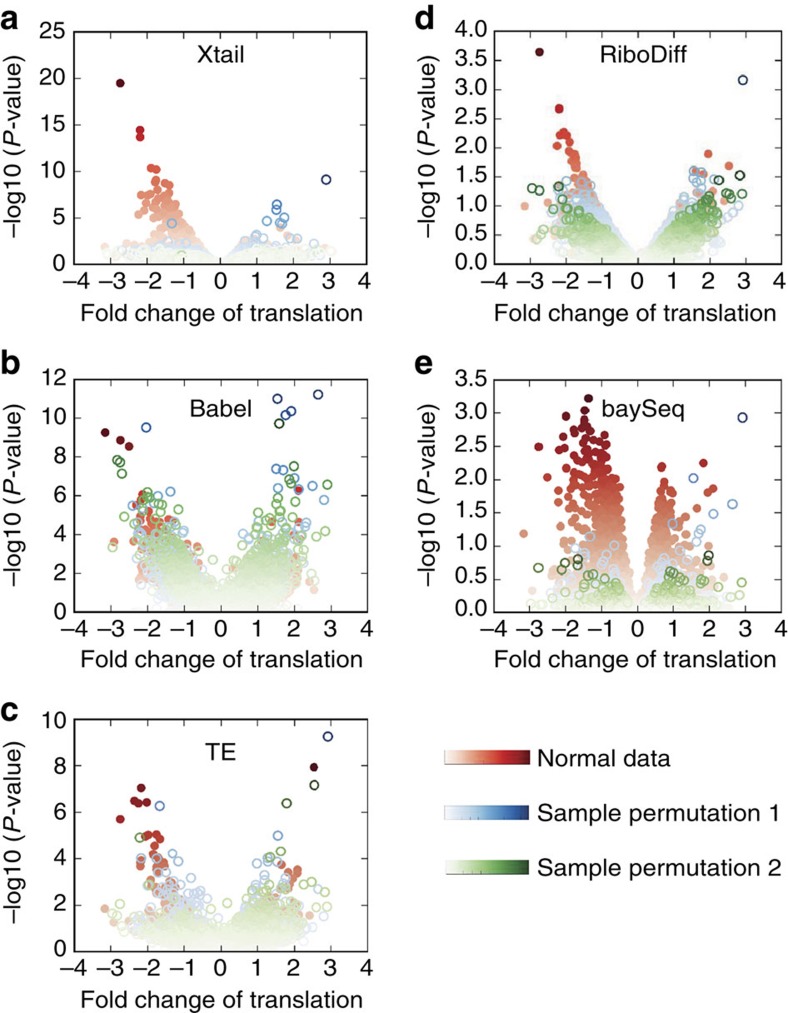
Figure 3. Volcano plots from Xtail and existing methods applied on the PC3 data.
Xtail, Babel, TE, RiboDiff and baySeq were applied on the normal and condition-permutated ribosome profiling datasets from the PC3 study. The results are summarized as volcano plots for Xtail (a), Babel (b), TE (c), RiboDiff (d) and baySeq (e). Log2 of the translational fold change is shown on the horizontal axis, and −log10 of the P value is shown on the vertical axis.

