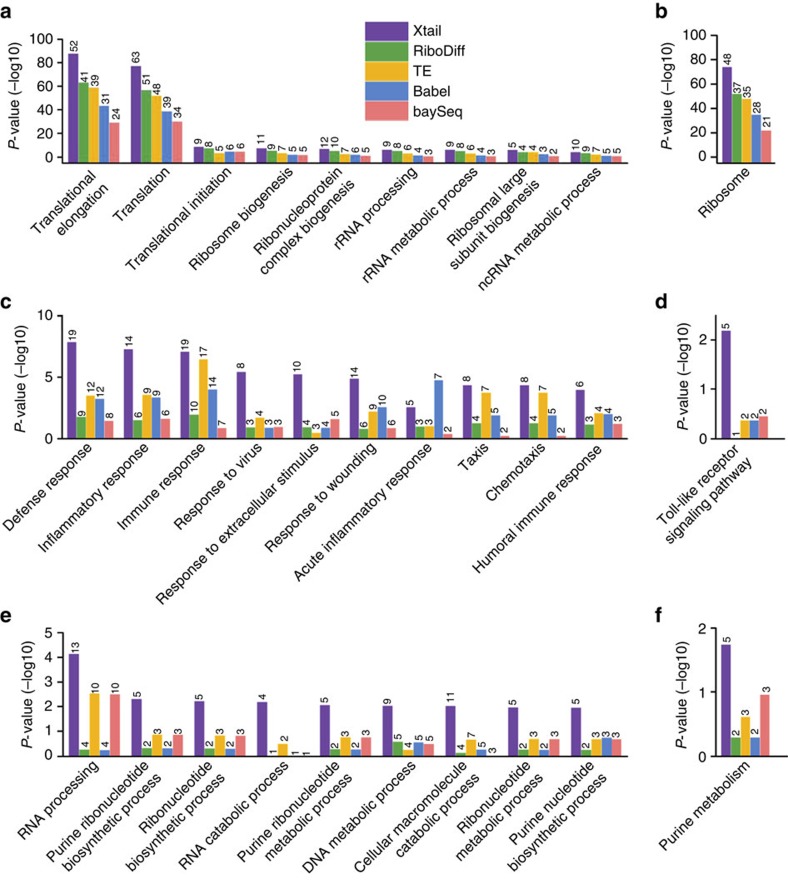
Figure 5. Biological processes and functional pathways enriched in the differentially translated genes identified by different methods.
(a,b) Biological processes in GO (a) and KEGG pathways (b) enriched in top 100 down-regulated genes identified by five methods with the PC3 data. (c–f) Biological processes (c,e) and KEGG pathways (d,f) enriched in top 100 upregulated (c,d) and down-regulated (e,f) genes identified by five methods with the macrophage data. P values of the enrichments are shown on the vertical axes in −log10 scale. The number on top of each bar represents the number of genes, within the up- or down-regulated gene sets, falling in the specified category of biological process or pathway.

