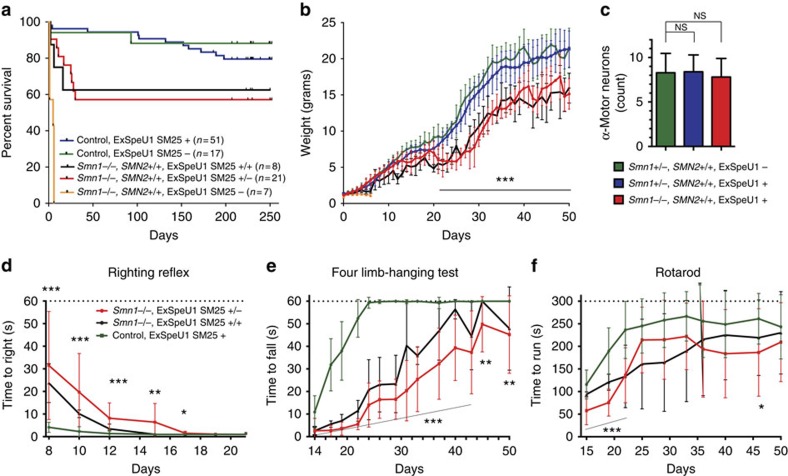
Figure 2. Improved phenotype and survival in SM25 transgenic SMA mice.
(a) Kaplan–Meier survival curves from P0 to P250. Control ExSpeU1− corresponds to Smn1+/+, SMN2+/+ ExSpeU1−/− genotype; control ExSpeU1+ include hemizygote (Smn1+/+, SMN2+/+, ExSpeU1+/−, n=40) and homozygote (Smn1+/+, SMN2+/+, ExSpeU1+/+, n=11) animals; Smn1−/−, ExSpeU1− are SMA-affected mice. SMA-rescued are divided into hemizygote (Smn1−/−, SMN2+/+; ExSpeU1+/−) and homozygote (Smn1−/−, SMN2+/+; ExSpeU1+/+) mice. (b) Body weight from P1 to P50. (c) Number of α-motor neurons in SMA-rescued animals and controls at P40. (d) Righting reflex between P8 and P21; Control (n=18), Smn−/−, SMN2+/+, ExSpeU1+/− (n=18), Smn−/−, SMN2+/+, ExSpeU1+/+ (n=3). (e) Four limb-hanging test in mice between P14 and P50: SMA-rescued mice Smn−/−, SMN2+/+, ExSpeU1+/− (n=17) and Smn−/−, SMN2+/+, ExSpeU1+/+ (n=3) show less ability than control animals (n=17) to hang on the grid. (f) Rotarod test in mice from P15 to P50. Rescued-SMA mice Smn−/−, SMN2+/+, ExSpeU1+/− (n=14), Smn−/−, SMN2+/+, ExSpeU1+/+ (n=3) stayed less time on the rotarod than the control group (n=14); although after P22, there was no significant difference between the groups. Values between control and Smn−/−, SMN2+/+, ExSpeU1+/− mice are shown as mean±s.d. Student's t-test *P≤0.05, **P≤0.01, ***P≤0.001; NS, not significant.

