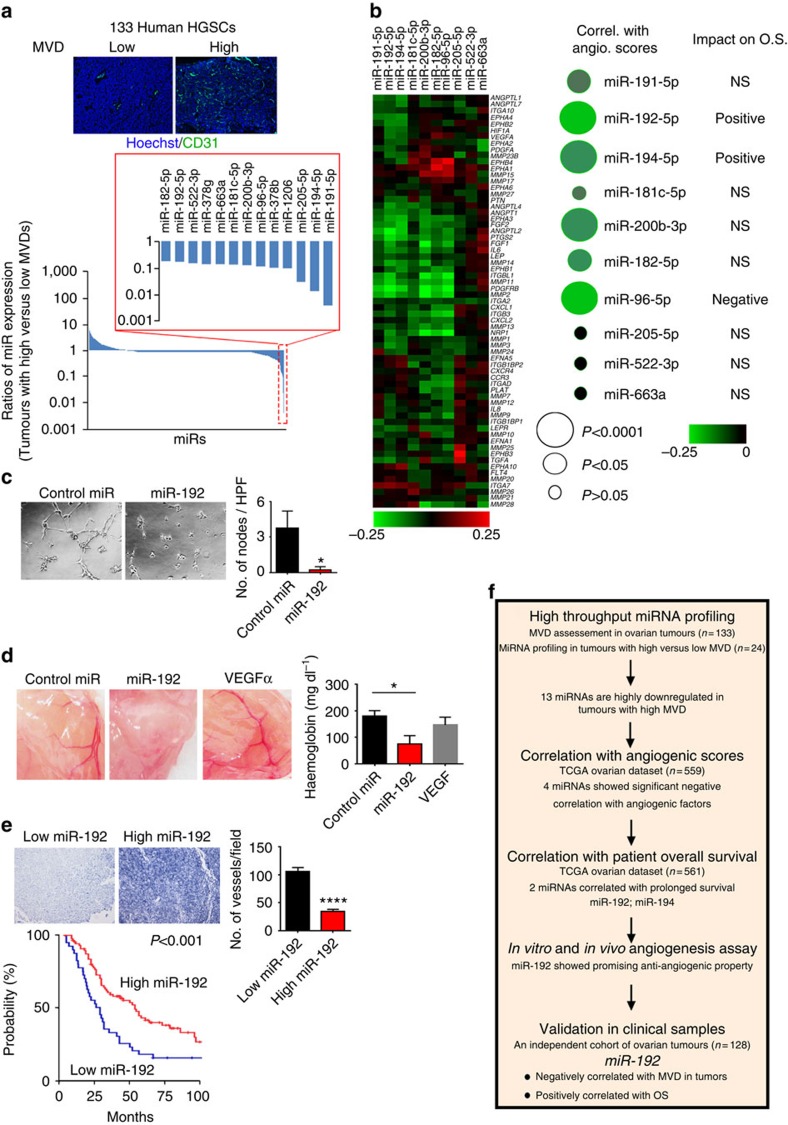
Figure 1. Integrative analyses identified miR-192 as a key player in tumour angiogenesis.
(a) MiRNA profiling in tumours with very high (>36 vessels per high power field (HPF), n=12) or low (<16 vesselsper HPF, n=12) microvessel density (MVD). MVD was assessed in high-grade serous ovarian cancers (HGSC) using CD31 staining (n=133). Representative images of tumours with high and low MVD are shown. (b) Correlation (Correl.) between the levels of angiogenic (angio.) factors and expression of miRNAs that were downregulated in highly angiogenic tumours. Correlation analysis was performed using TCGA ovarian cancer data set (n=559, Spearman test). Angiogenesis scores were computed for each individual sample based on the overall relative expression of the pro-angiogenic factors (Supplementary Data 2). The log-rank test was used to determine the association between miRNA expression and OS. (c) Tube formation potential of RF24 cells following the exposure to conditioned media collected from SKOV3ip1 cells treated with control miRNA or miR-192 (48 h post transfection). Tube formation potential was assessed 6 h post incubation (n=5, Student's t-test). (d) Representative images (left) and haemoglobin quantification (right) of the in vivo matrigel plug assay (n=3, Student's t-test, 7 days post injection). Matrigel was mixed with VEGF alone (positive control) or conditioned media collected from SKOV3ip1 cells treated with control miRNA or miR-192. (e) Correlation between miR-192 expression levels and MVD (Student's t-test) or OS (log-rank test) in an independent cohort of human ovarian tumours (n=128). MVD was quantified via CD34 staining. (f) A flow-chart describing methods used for identifying important anti-angiogenic miRNAs. Scale bar, 100 μm. Bars and error bars represent mean values and the corresponding SEMs (*P<0.05; ****P<0.0001).

