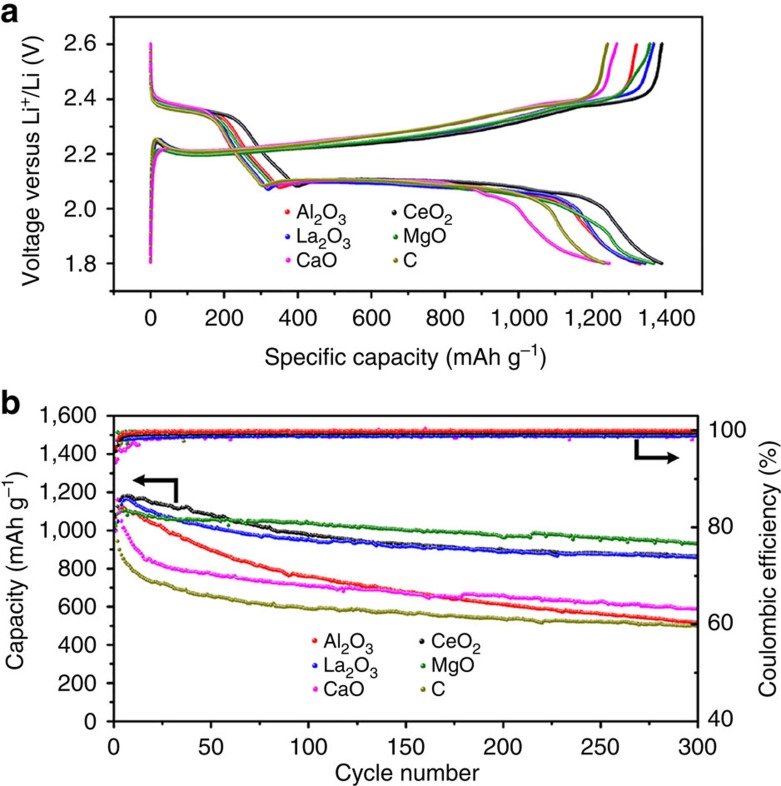
Figure 4. Charge–discharge curves and cycling performance of the sulfur composite electrodes.
(a) Representative charge–discharge profiles of the composite electrodes based on different oxide/carbon nanostructures at 0.1 C. (b) Specific capacity and the corresponding Coulombic efficiency of the composite electrodes upon prolonged 300 charge–discharge cycles at 0.5 C.

