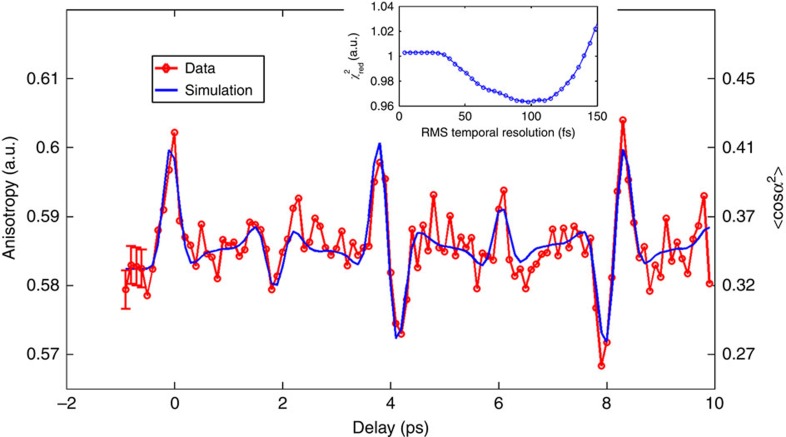
Figure 3. Temporal evolution of the N2 rotational wavepacket.
Anisotropy in the diffraction patterns from experimental data (red) and simulation (blue) versus time. Statistical error bars for the first few points (before alignment) are shown to illustrate the uncertainty of this measurement. The right-hand side axis gives the degree of alignment <cos2α> for the simulated curve. The simulation parameters of initial rotational temperature, alignment laser fluence, temporal resolution and rescaling factor are obtained from a fitting routine. Each data point is accumulated over 2 min. Reduced χ2 error versus RMS temporal resolution in the four-parameter fit is shown in the inset.

