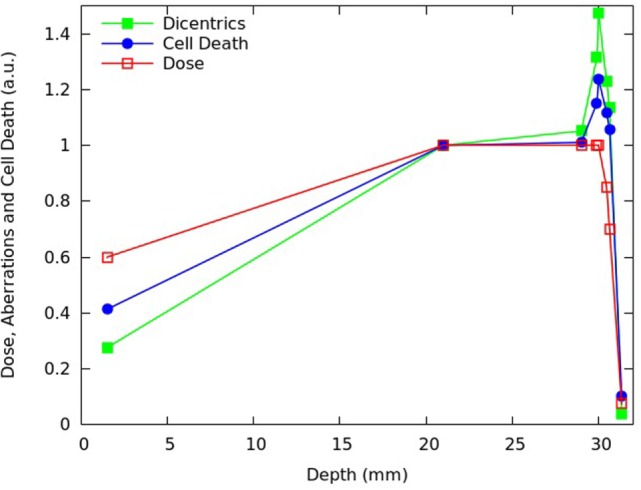
Figure 11.

Predicted fraction of inactivated cells (blue symbols) and mean number of dicentrics per cell (green symbols) for V79 cells at different depths of the SOBP dose profile reported in Chaudhary et al. (17), which is also shown in the figure (red symbols). Each quantity was normalized to the proximal point. The lines are simply guides for the eye.
