
Figure 2.
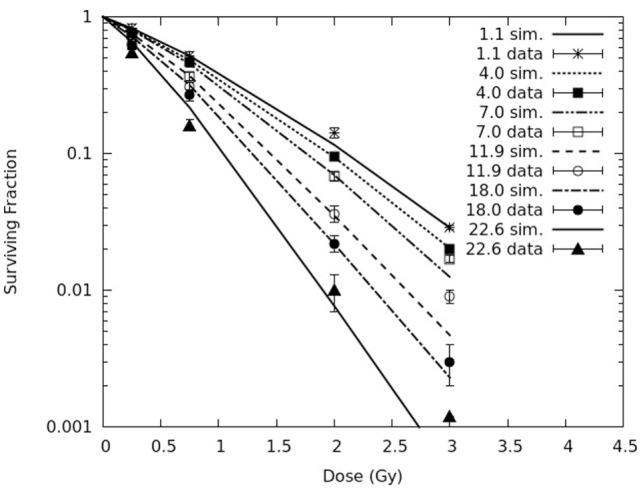
Cell survival curves for AG01522 primary normal human fibroblasts exposed to six pristine proton Bragg peaks (corresponding to the following LET values: 1.1, 4.0, 7.0, 11.9, 18.0, and 22.6 keV/μm). The lines are simulation outcomes, the points are experimental data taken from Chaudhary et al. (17).