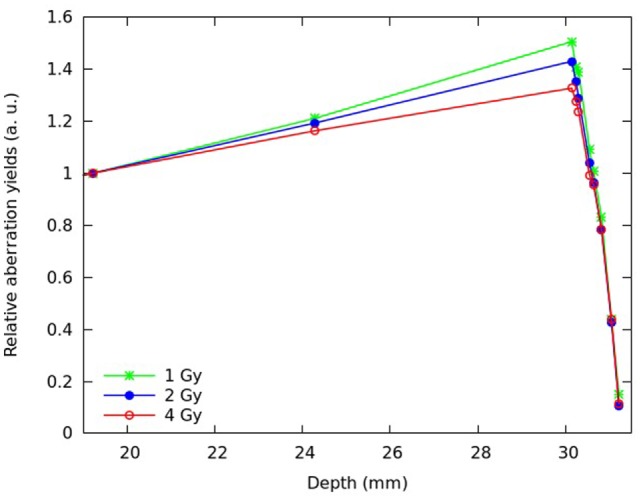
Figure 7.

Predicted mean number of dicentrics per cell at different depths along the SOBP, assuming a plateau dose of 1 Gy (green symbols), 2 Gy (blue symbols), or 4 Gy (red symbols). Each quantity was normalized with respect to the proximal position; the lines are simply guides for the eye.
