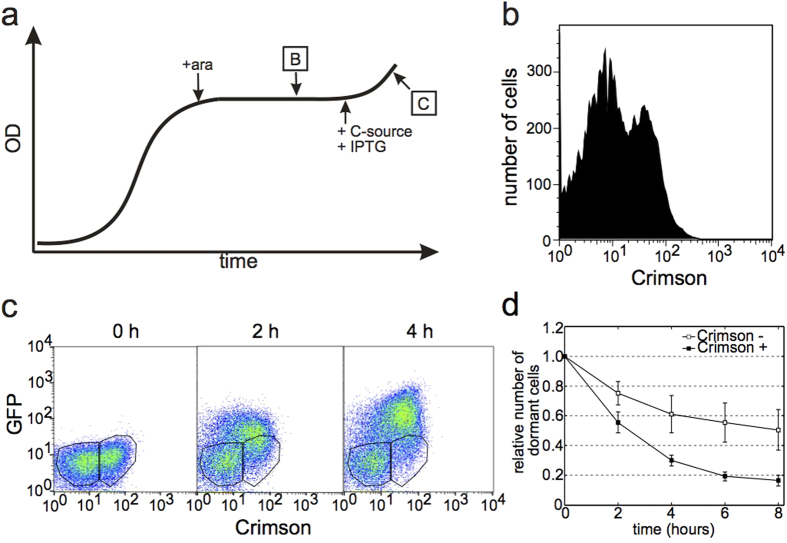
Figure 2. Growth resumption order depends on the entrance into stationary phase.
(a) Experimental scheme to mark differences at the entrance into stationary phase. B and C refer to subsequent panels. (b) Crimson expression profile of stationary phase culture induced at the end of the growth phase. Two subpopulations are clearly distinguished from each other and the whole distribution is bimodal (Hartigan’s dip test for unimodality, D = 0.0061, p < 2.2 × 10⁻¹⁶). (c) Flow cytometry analysis of cells resuming growth. Crimson positive and Crimson negative subpopulations are gated separately for further analysis. (d) Growth resumption of cells from two different (Crimson-positive and Crimson-negative) subpopulation. Number of dormant (GFP-negative) cells is plotted at every timepoint. Values are an average from three independent experiments and error bars indicate s.e.m. Time-courses were analysed using linear regression t-test in Graphpad software package (GraphPad Software, USA) and found to be significantly different from each other (p = 0.0114).

